
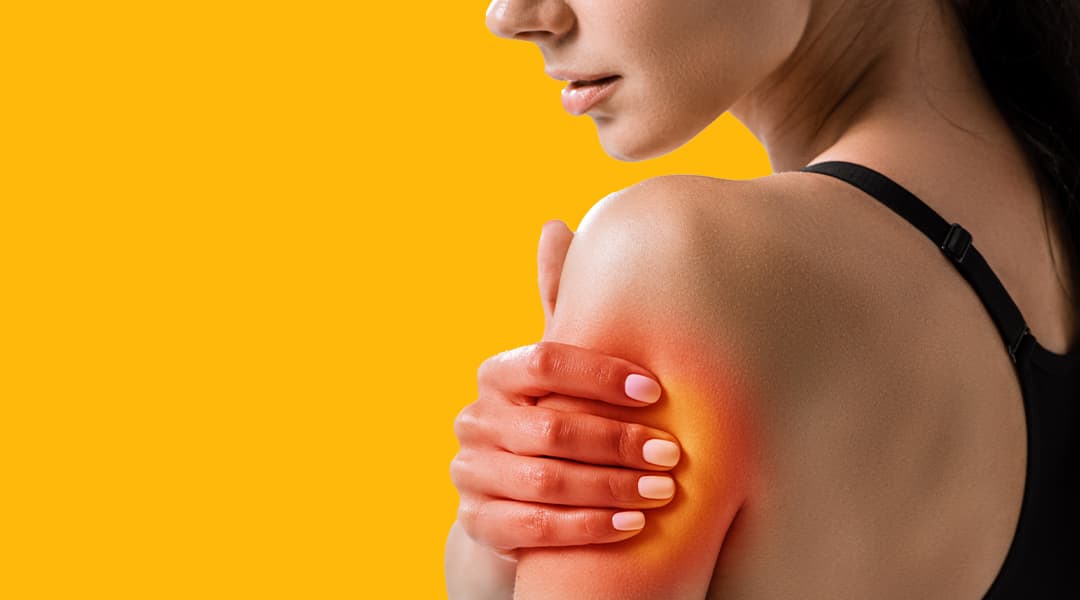
CPG
Adelaide’s AU Power Curve Analysis Suggests Media Quality Floors to Boost Brand Lift for Pain Relief Brand
Goals
- Leverage Adelaide AU to assess media quality and the relationship between ad exposures and outcomes
- Find optimal balance of media quality & frequency to achieve the best results
- Uncover opportunities to increase efficiency using attention metrics
Approach
- Analyze the correlation between frequency and outcomes at varying levels of media quality (AU) for each KPI
- Gradually discard low-AU ad exposures to raise the media quality minimum
- Identify the optimal AU threshold based on where the correlation between increased exposures and brand lift is the strongest
- Partner with Lucid to demonstrate that AU Floors drive incremental lift
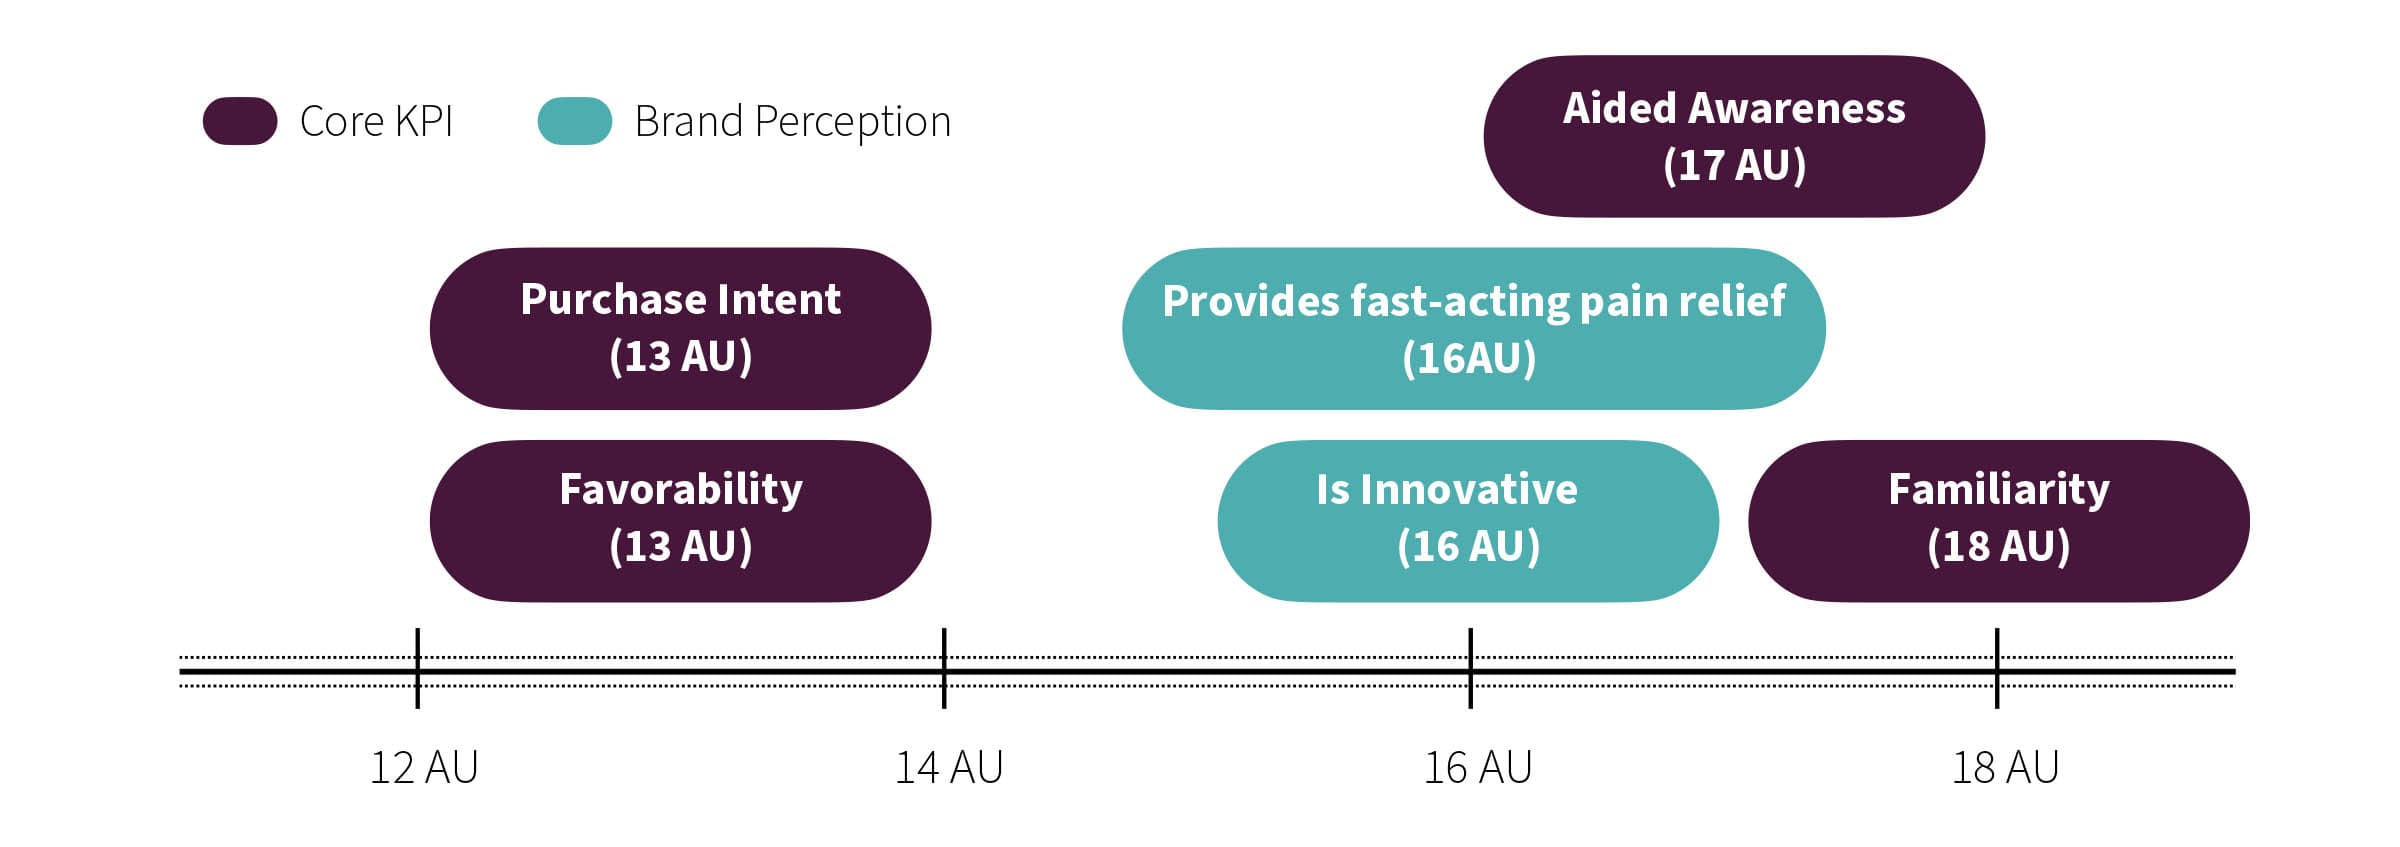
Finding Optimal Media Quality
Optimal AU Floors for the brand’s KPIs range from 13–18 AU.
Results
Purchase Intent & Favorability Increase with AU Floors
People exposed to four ads with quality above 15 AU were more likely to purchase and favor the product than those exposed to the same number of ads at lower quality, according to Lucid.
Identical Results for a Lower Cost
The pain-relief brand can use AU Floors to save 9% of media from running in low-quality placements.