
Attention Metrics 101
What Are Attention Metrics? The Fundamentals.
Quick Answer: Attention metrics measure an ad’s potential to capture attention and drive outcomes. They range from viewability proxies and duration estimates modeled on eye-tracking data to predictive media quality scores. For planning and buying, the most useful are placement-level metrics trained on and validated against full-funnel outcomes, including brand lift, conversions, and sales.
Kaitlin Nizolek, VP, Marketing @ Adelaide
Kristin Rose, Marketing Director, Demand Generation @ Adelaide
Why Do Attention Metrics Matter?
Reach has anchored media plans for decades, and it still matters. But not all reach is created equal. As channels, formats, and devices multiplied and audiences split across them, it became harder to see the quality of each exposure.
Viewability and video completion rate (VCR) were supposed to fill that gap. They didn’t. Viewability measures whether an ad impression meets minimum on-screen exposure standards, while VCR tracks how often a video plays to completion. Neither tells an advertiser whether a placement is likely to make an impact.
Even so, viewability became the industry’s default quality check. Many marketers optimized toward viewable impressions at the lowest possible CPM, and sellers responded by producing more of that inventory.
Made-for-advertising (MFA) sites take this to the extreme by flooding pages with ad units designed to maximize viewability at below-market CPMs. But low-quality placements aren’t limited to MFA sites. An Adelaide analysis of more than 25 billion display impressions found that over 90% of placements with unusually high viewability but low quality scores (as measured by Adelaide’s AU metric) appeared on sites not classified as MFA.
Without a reliable quality metric, buyers can’t tell whether a higher CPM buys better media. The result is a disconnect between price and quality, where cheaper inventory can look more valuable even when it underdelivers.
Economists call this a lemon market. When buyers can’t tell high-quality goods from low-quality ones, they default to paying less, and quality gets pushed out. CARFAX helped address this problem in the used car market by making vehicle history transparent. Attention-based media quality metrics can bring similar transparency to advertising, giving buyers a reliable quality signal and rewarding sellers that invest in better media.
What Do Attention Metrics Measure?
Attention metrics measure or predict an ad’s ability to earn attention. They range from exposure-and-engagement signals to duration-based measures and predictive media quality scores, each built on different data and suited to different uses.
The category took shape around 2015. Viewability was being gamed, and buyers saw that the metric said little about media quality. Duration-based attention metrics (DBAMs) came first. Early work at Parsec by Adelaide’s founding team was among the first to show a consistent link between attention and brand lift outcomes.
But when advertisers began optimizing impressions toward longer attention, business outcomes didn’t consistently follow. Most definitions miss the reason. Media alone doesn’t create attention. It comes from three inputs working together, as Adelaide’s Attention Pathway shows:
- Media: Where and how the ad appears. Quality media captures attention.
- Creative: What the ad says and how it says it. Strong creative holds attention and communicates a message.
- Audience: Who sees the ad, including their demographics, brand familiarity, and prior exposure. Relevance and repetition influence whether attention translates into memory and action.
That matters for how you use the data. A metric shaped by media, creative, and audience can’t isolate media quality, so optimizing toward it maximizes attention across all three at once. Delivery can drift toward audiences already inclined to look longer, and scores can rise with creative that holds attention, even when placement quality hasn’t improved. That’s why marketers should be careful not to treat raw attention as a media KPI.
The Main Types of Attention Metrics
Here’s how the main types compare, starting with hygiene metrics like viewability, the industry baseline.

Get the full breakdown of how viewability, duration, and AU compare
Why More Seconds Isn’t Always Better: The Attentive Audience Paradox
The Attentive Audience Paradox describes how optimizing for attention duration can skew delivery toward people already predisposed to pay attention, potentially at the expense of audiences with more room to move. Adelaide first described it in WARC.
Duration-based attention metrics reward seconds, and seconds depend on media, creative, and audience. Advertisers that optimize for longer attention may inadvertently shift audience delivery or favor creative that holds attention without improving underlying media quality.
For instance, older viewers and people who already know your brand tend to look at ads longer. Meta’s research found that younger viewers pay less attention to video ads than older audiences, on social and TV alike. TVision research also shows that attention to TV ads can increase with repeated exposures. A campaign that maximizes attention seconds may overindex toward these groups.
Seconds also lose value as they add up, and they mean different things in different places. The first moments of attention tend to deliver the most impact. Five seconds on a display ad is a different experience from five seconds on CTV, making duration hard to compare across a media plan.
The fix is to measure media by a placement’s probability of capturing attention and contributing to outcomes, which is what Adelaide AU is built to do.
Duration-Based vs. Probability-Based Attention Metrics
How Does Adelaide Measure Attention?
A media placement’s job is to create the conditions for advertising to work by capturing attention. This gives creative the opportunity to sustain that attention and influence outcomes. Adelaide’s AU metric measures how well each placement does that job.
AU is a 0–100 media quality score that predicts a placement’s likelihood of capturing attention and driving business outcomes. Adelaide’s channel-specific AU models draw on three types of data:
- Placement and device signals, including ad coverage, page geometry, clutter, and placement position, along with channel-specific inputs like CTV program genre and pod position
- Eye-tracking research from opted-in panels, licensed from providers including Lumen Research, Tobii, TVision, Amplified Intelligence, and Viomba, and supplemented by Adelaide’s own studies
- Full-funnel outcome data, spanning brand awareness through conversions and sales, which trains and validates the models and determines how much each signal counts
The result is a consistent, omnichannel media quality metric that helps advertisers plan, buy, and optimize more effectively.
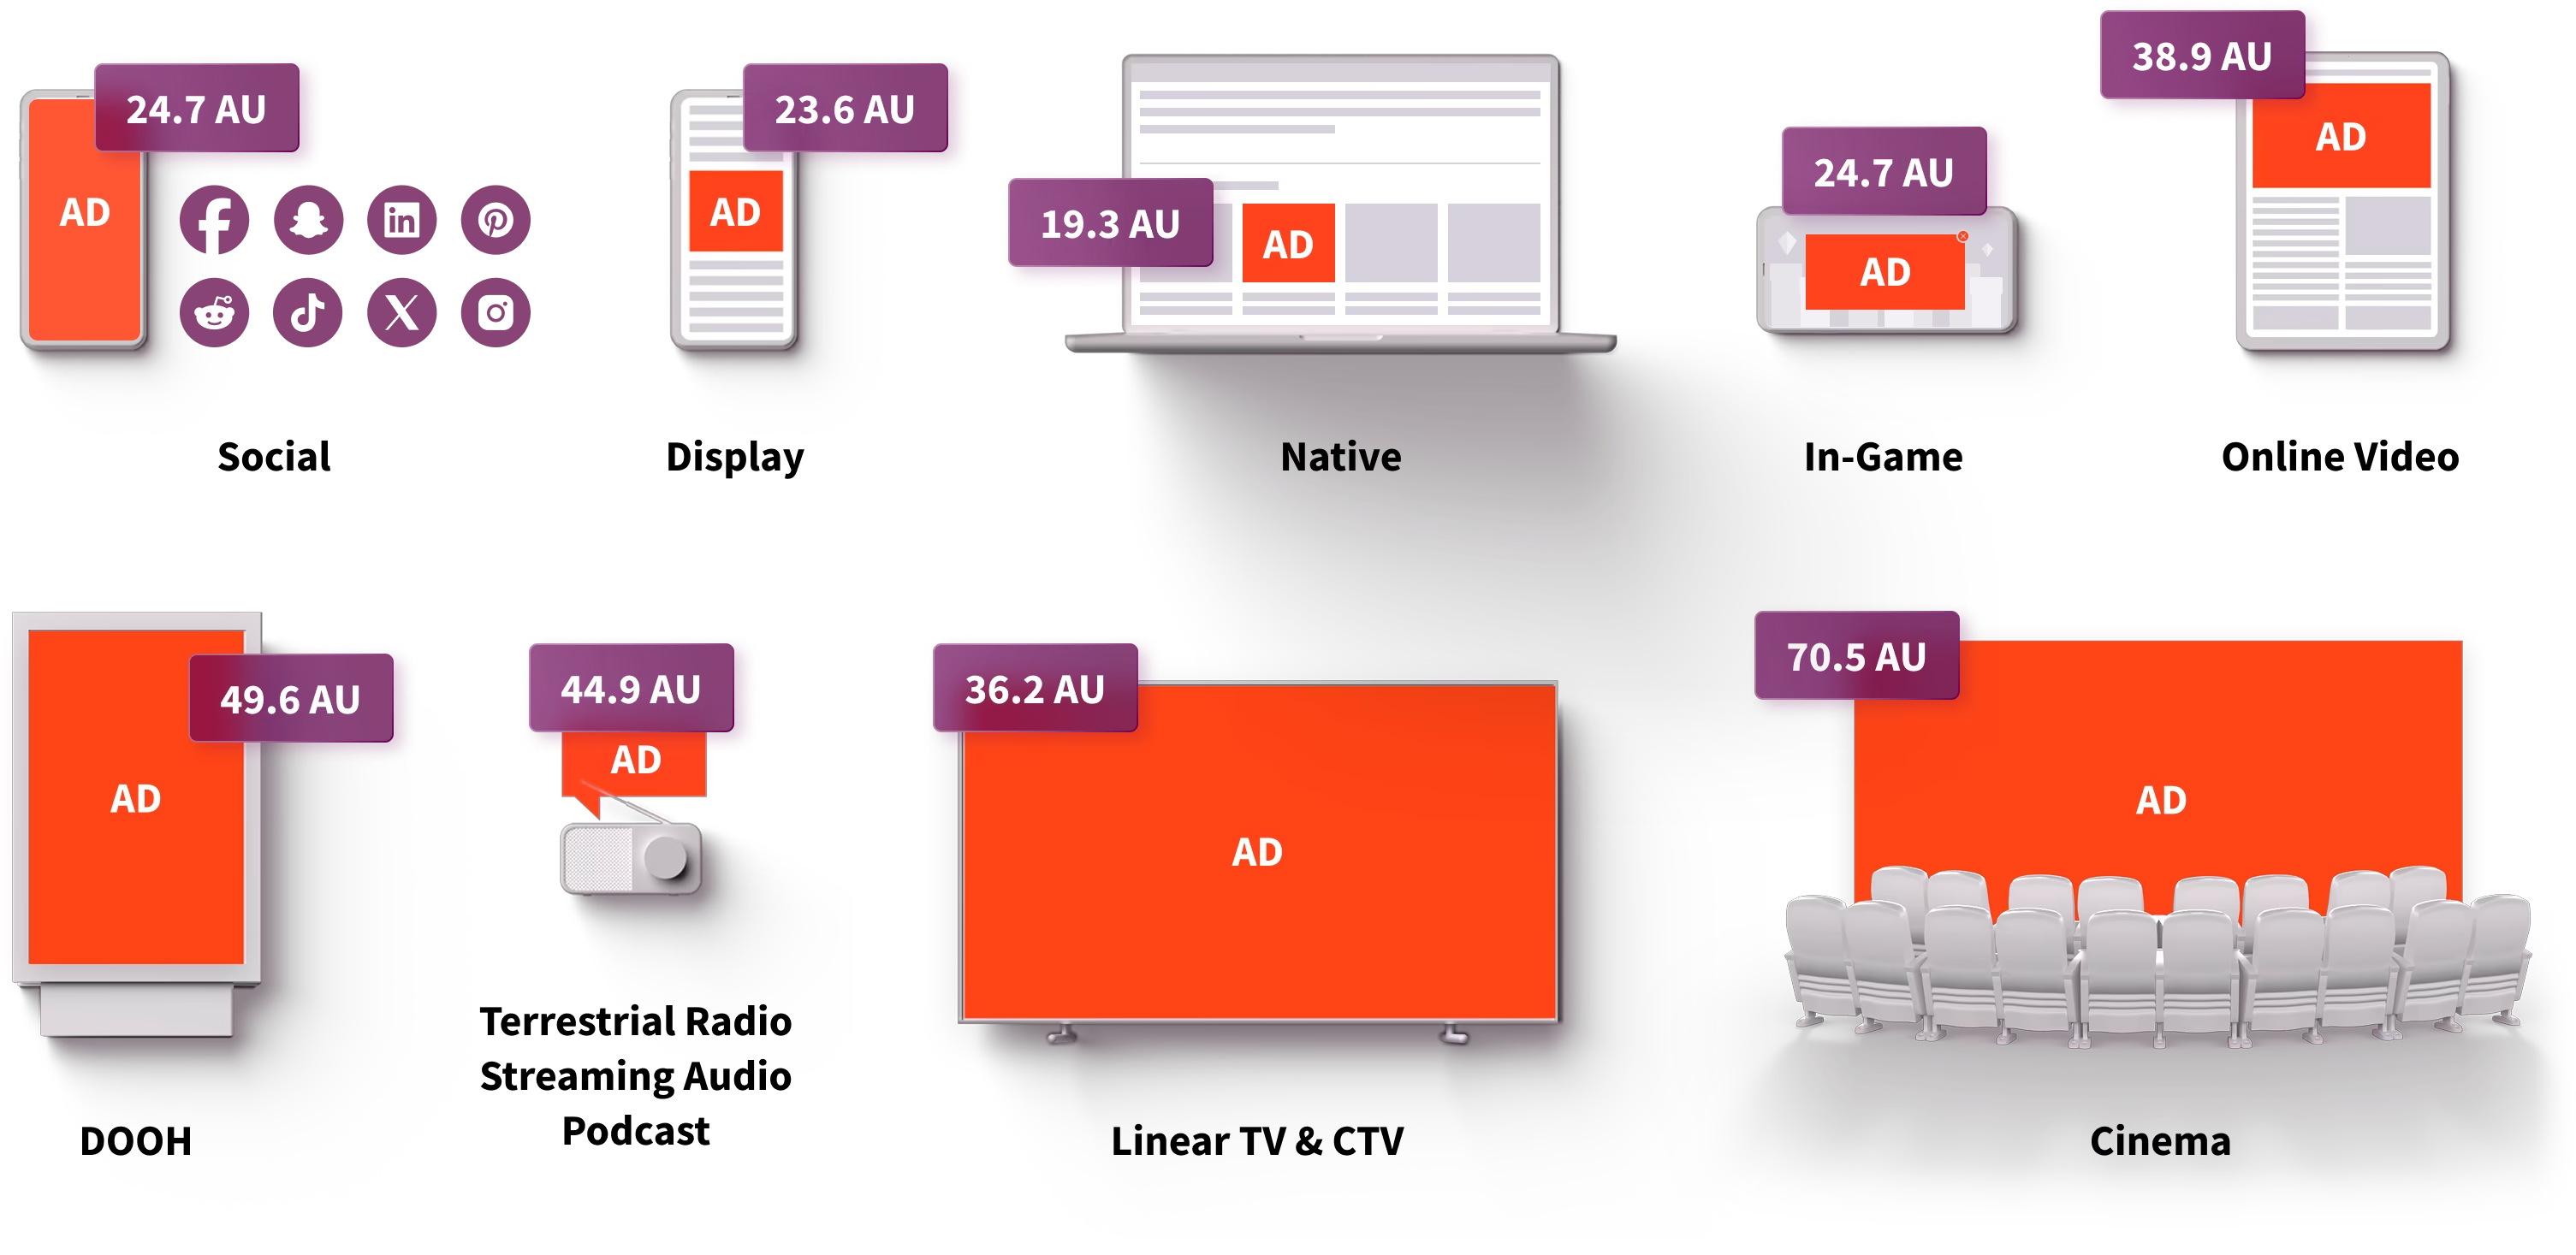
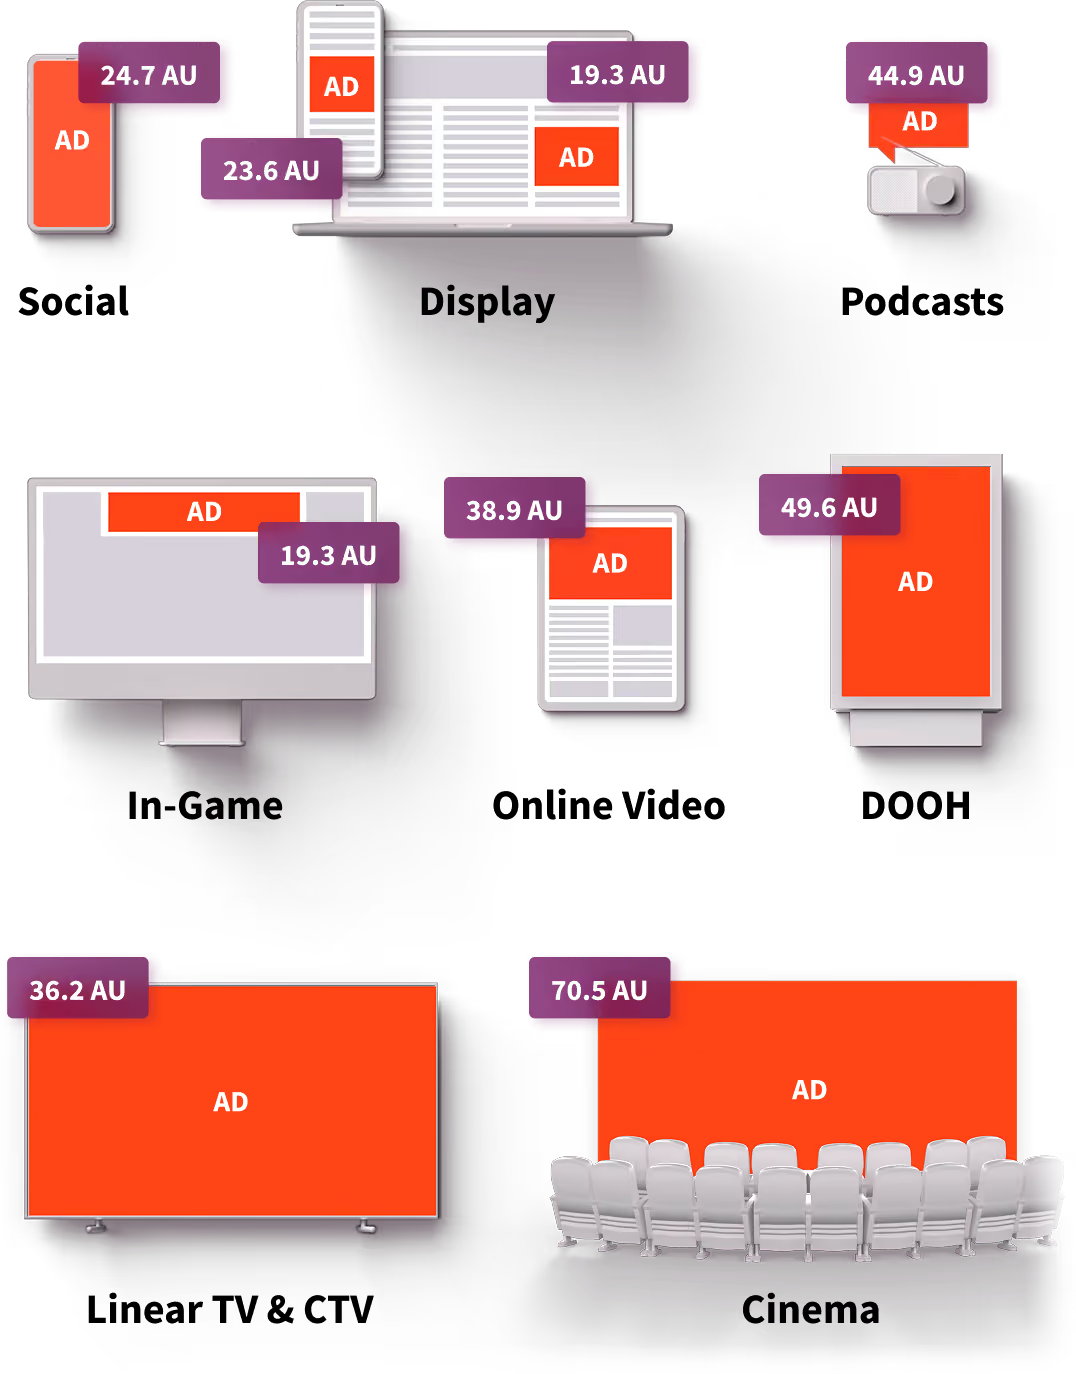
AU is normalized across channels, so marketers can compare quality across environments. It covers roughly 95% of a typical advertiser’s paid media spend across 19 channels, including display, OLV, CTV, social, audio, linear TV, DOOH, and cinema.
Because AU is trained on full-funnel outcomes, a higher score signals media more likely to contribute to business results. And because it scores quality at the placement level, independent of audience and creative, advertisers can use it to assess media quality before they buy and optimize without the unintended biases of maximizing attention duration.
What AU Reveals About Media Value
Two placements with the same CPM and viewability can differ dramatically in quality. With a consistent quality score, buyers can see the difference and weigh a placement’s cost against its predicted impact.
Cost per AU (CPAU) puts price and quality in one number. It’s a placement’s CPM divided by its average AU, showing what you pay for each unit of media quality. Teams use it to compare placements and partners on a quality-adjusted basis.
Take two video placements:

vs.

The placement on the left costs 3x as much, with low viewability and low completion. The one on the right has a lower CPM and higher viewability and completion rates, but it’s a small player in the corner of the screen, the kind viewability standards tend to favor, averaging just 10 AU. CPAU reveals a different story: $0.30 per AU on the left versus $0.50 per AU on the right, so the more expensive placement delivers quality at a 40% lower cost. Judge on CPM, viewability, and completion rate alone, and you’d buy the wrong one.
The same lens shows where quality pays off. Adelaide helps brands find their optimal AU floor, the threshold where media quality delivers the strongest KPI lift while balancing cost and scale. This reveals where a higher CPM is worth it and where cheap reach falls short.

Smarter media quality signals drive more efficient outcomes.
Do Attention Metrics Improve Outcomes?
Consistently prioritizing higher-quality media drives stronger results, from brand awareness to sales. Adelaide’s 2026 Outcomes Guide features 60 campaigns across 16 industries, with an average 33% lift in upper-funnel KPIs and 53% stronger lower-funnel impact from AU-powered campaigns compared with other optimization approaches.
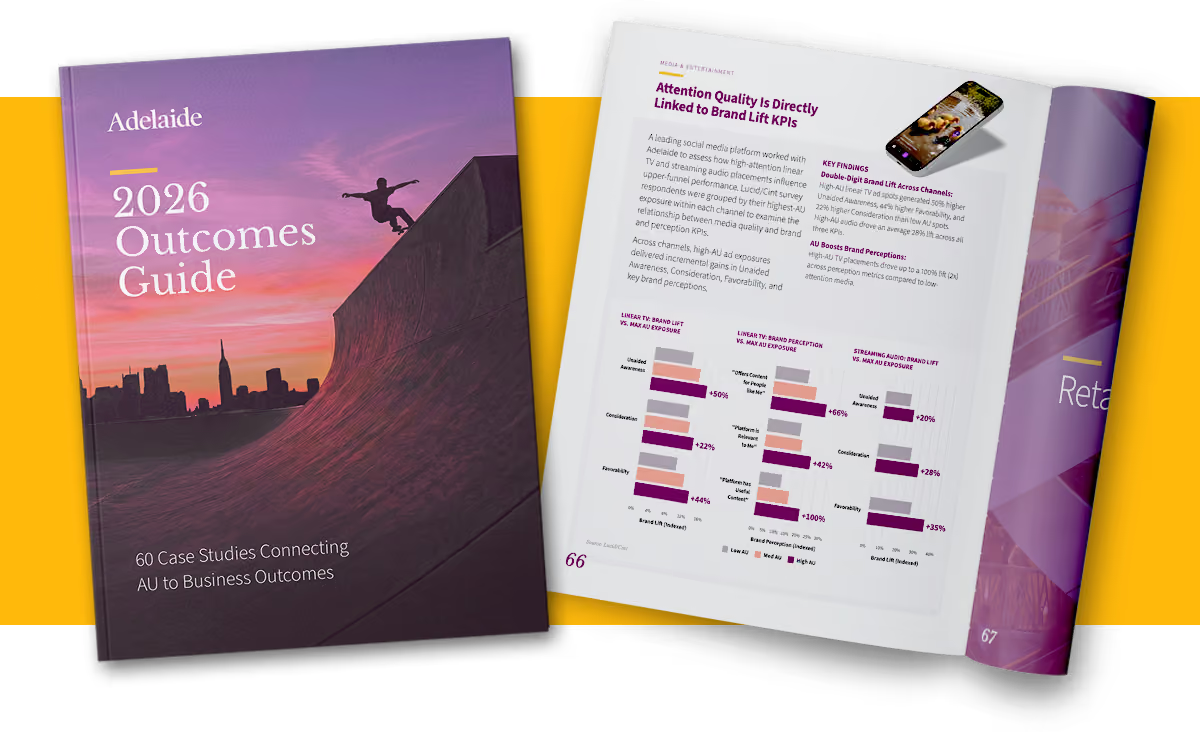
60
case studies
+33%
average upper-funnel lift
+53%
average lower-funnel lift
Campaign Results
- iFIT: +61% aided awareness and +18% consideration with AU pre-bid segments vs. control
- Haleon: Up to 37% lift in upper-funnel KPIs, 2.3x higher ROAS, and 34% higher conversion rates from high-AU CTV and display media
- Diageo: Nearly 2.5x greater sales impact from high-AU placements vs. low-AU media
- Global Bank: 2.8x more conversions and 70% lower CPA by optimizing with AU
Independent review backs this up. In 2025, MediaSense audited AU’s methodology and found statistically significant positive relationships between AU and all four measured brand KPIs: aided awareness, familiarity, ad recall, and intent. The review also confirmed that AU’s methodology is transparent and reproducible.
Want to explore all 60 campaigns?
How To Use Attention Metrics
Attention metrics are most valuable when they guide investment decisions at every stage of a campaign. AU fits into the workflows media teams already use, from planning to post-campaign analysis:
- Plan. Compare media quality across partners, channels, and formats before you commit budget. AU puts a CTV app, a podcast, and a news site on the same scale, and channel- and KPI-specific AU floors help establish optimal quality thresholds. In marketing mix models (MMM), AU-weighted impressions add a placement-level quality dimension, helping identify where higher CPMs are worth paying and sharpening budget allocation decisions. Media Planning With Attention Metrics →
- Negotiate. Build AU into RFPs and media contracts. Because placement-level scores exist before media runs, buyers can set quality standards and negotiate AU Guarantees with publishers.
- Activate. Use AU where you already buy, across 125+ integrations with DSPs, SSPs, and other platforms, including Amazon DSP, Google DV360, Magnite, PubMatic, and The Trade Desk. Solutions like AU pre-bid segments, custom bidding, and high-AU PMPs help advertisers prioritize higher-quality inventory through existing workflows. Programmatic Activation →
- Measure. Track average AU and cost per AU across campaigns, partners, and channels. Add AU to partner scorecards to reward consistent quality.
- Optimize. Use AU reporting to shift budget toward the partners and channels delivering the most cost-efficient media quality, refine your AU floors, and exclude inventory that typically falls short.