
Adelaide AU vs. IAS Quality Attention: Attention Measurement Comparison

IAS and Adelaide both use attention data to build fundamentally different metrics. Quality Attention scores individual impressions, so audience composition, user behavior, and exposure conditions can all influence the signal alongside media quality. AU evaluates media quality at the placement level, creating a more consistent signal for comparing and optimizing media.
IAS built its business on ad verification, measuring viewability, invalid traffic, and brand safety. Quality Attention extends that infrastructure into attention measurement, combining signals from IAS’s core verification technology with eye-tracking data from Lumen Research. Where Quality Attention grew out of verification, Adelaide AU was built specifically to measure media quality, using attention as one input to a score designed to predict business outcomes.
There is some overlap in the underlying data, including Lumen eye-tracking research and placement-related characteristics. Adelaide AU, however, is more tightly focused on media-driven factors, draws on a broader range of channel-specific placement signals, and is trained and validated against upper- and lower-funnel outcomes. IAS Quality Attention combines some placement characteristics with user interaction signals, and its public disclosures on model training cite only conversion events.
What IAS Quality Attention Measures
IAS Quality Attention combines three signal families to produce an impression-level attention score:
- Visibility: Signals that overlap with IAS’s existing verification metrics, such as viewability
- Situation: Ad density, share of screen, device type, and ad format
- Interaction: Behaviors such as scrolling, pausing, resuming, skipping, and volume changes
IAS combines these signals with eye-tracking data from Lumen. Individual impressions are not directly eye-tracked. Lumen’s panel research instead helps IAS model attention using the signals available for each impression.
Quality Attention produces a 1–100 score, with IAS typically classifying scores of 65 and above as “above average” attention. IAS also says its model is trained on millions of conversion events and designed to predict whether an impression is likely to lead to a business result. However, IAS provides limited detail on how those outcomes inform the score, or whether it uses outcomes beyond conversions, such as awareness or consideration, to train the model. Ultimately, Quality Attention remains an impression-level attention metric built from IAS’s visibility, situation, and interaction signals and informed by Lumen eye-tracking research, rather than a placement-level measure of media quality.
What Adelaide AU Measures
Adelaide AU is a 0–100 media quality score designed to evaluate the quality of the media placement itself. It predicts how likely a placement is to capture attention and contribute to business outcomes.
AU draws on three primary data sources:
- Attention research: Eye-tracking data from fully opted-in panels helps identify the placement characteristics that make ads more or less likely to capture attention across different media environments. Adelaide has licensed data from providers including Lumen, Amplified Intelligence, Tobii, TVision, Adverteyes, and Viomba, along with its own research.
- Placement data: Characteristics of individual ad placements that affect the likelihood of attention. These vary by channel. On the web, they include ad coverage, page clutter, placement position, duration, and page velocity; in CTV, relevant factors include app, genre, pod position, and time of day.
- Outcome data: Full-funnel performance data, from brand lift to conversions and sales, sourced through survey and attribution partners and advertiser measurement. These outcomes determine how placement characteristics are weighted and are used to train and validate AU.
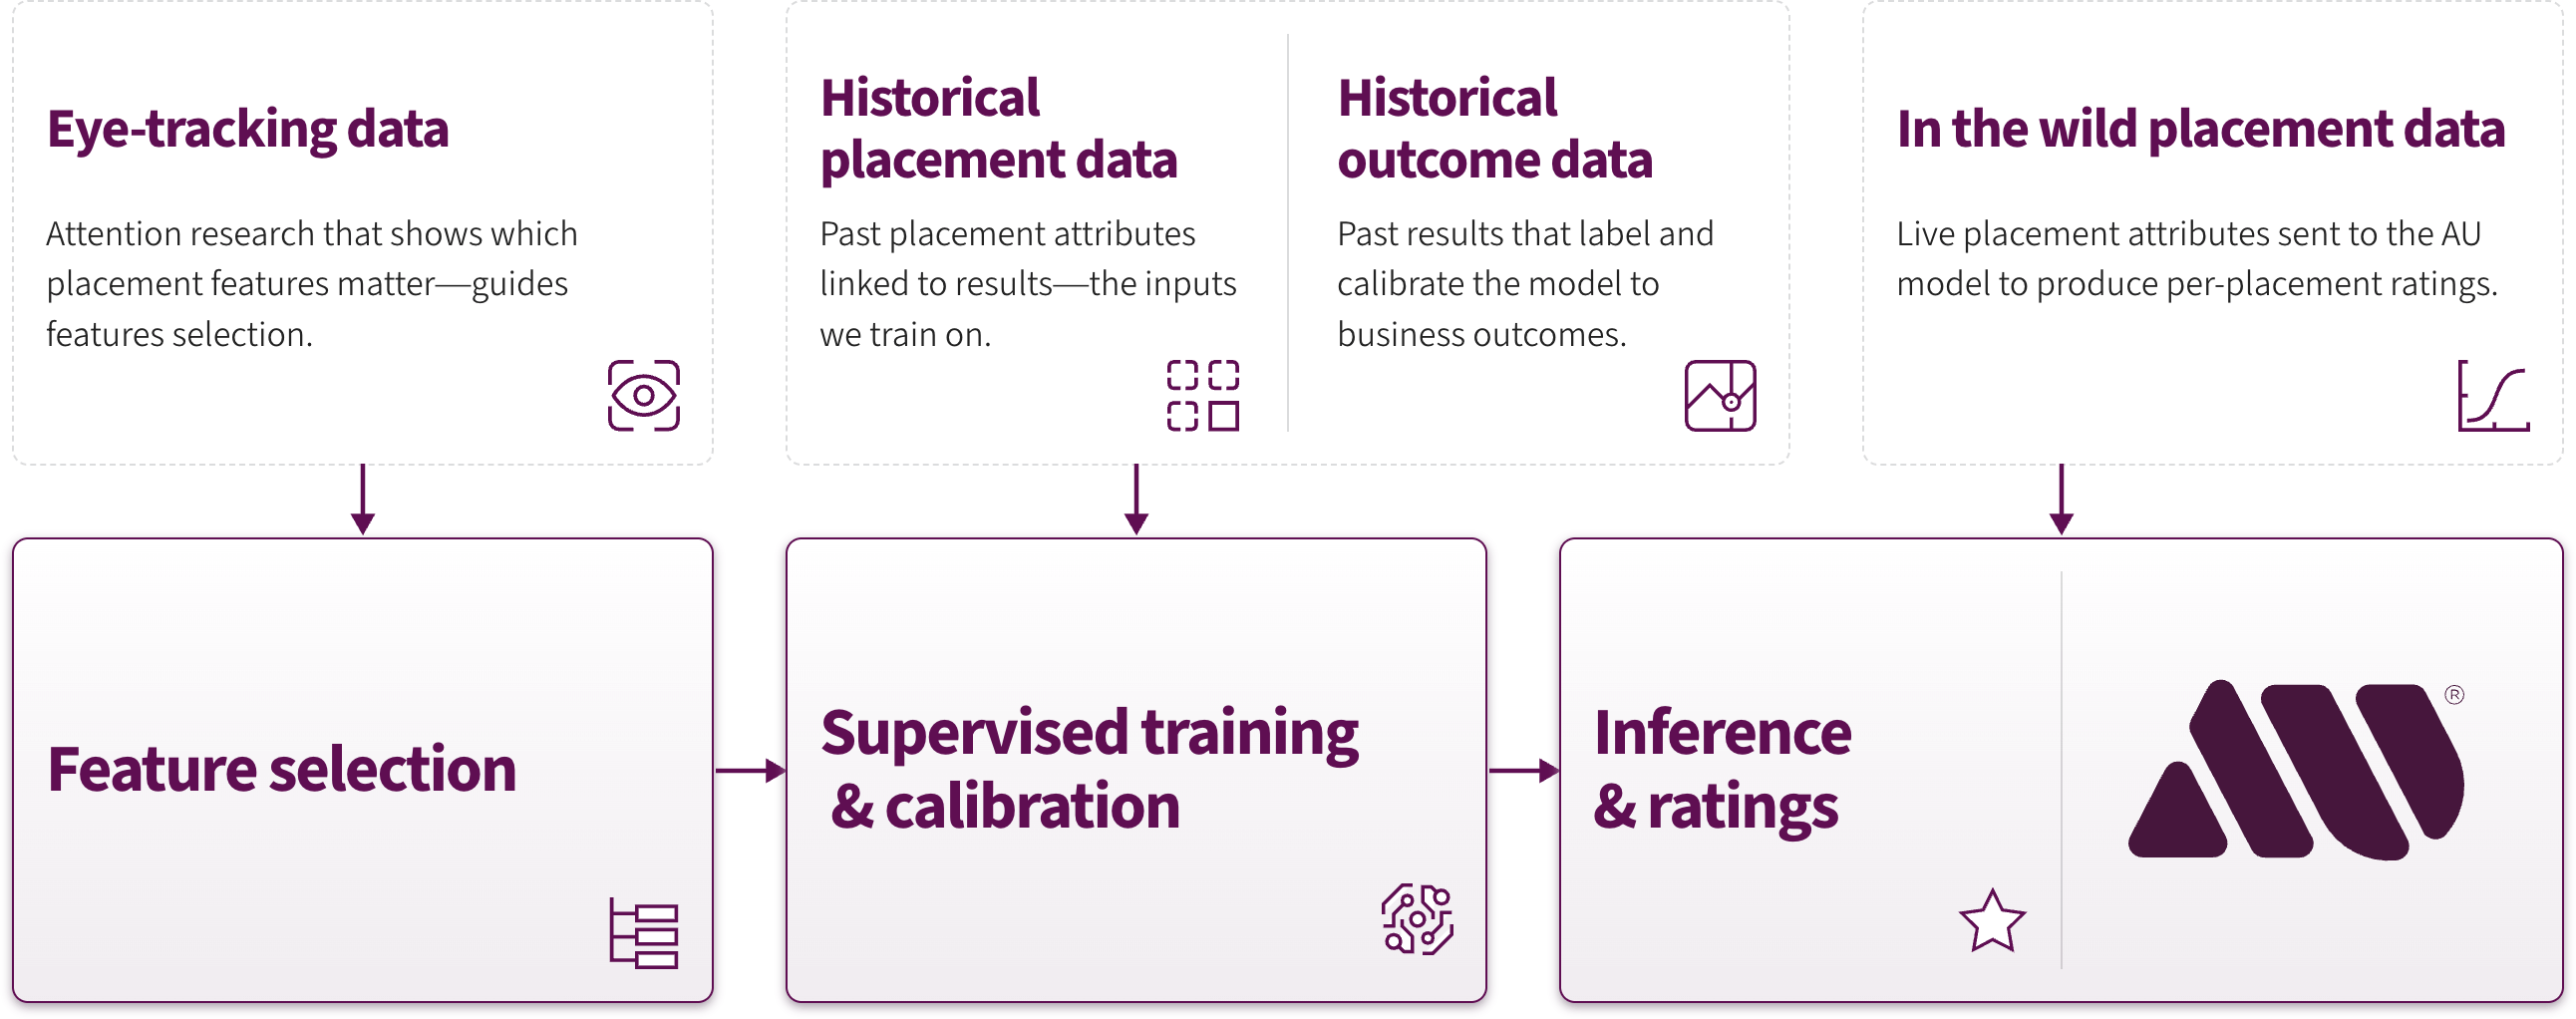
Because AU scores the placement rather than the impression, it separates media effects from those of specific creative or audience. That gives buyers a more stable basis for comparing inventory, guiding investment, and optimizing across channels.
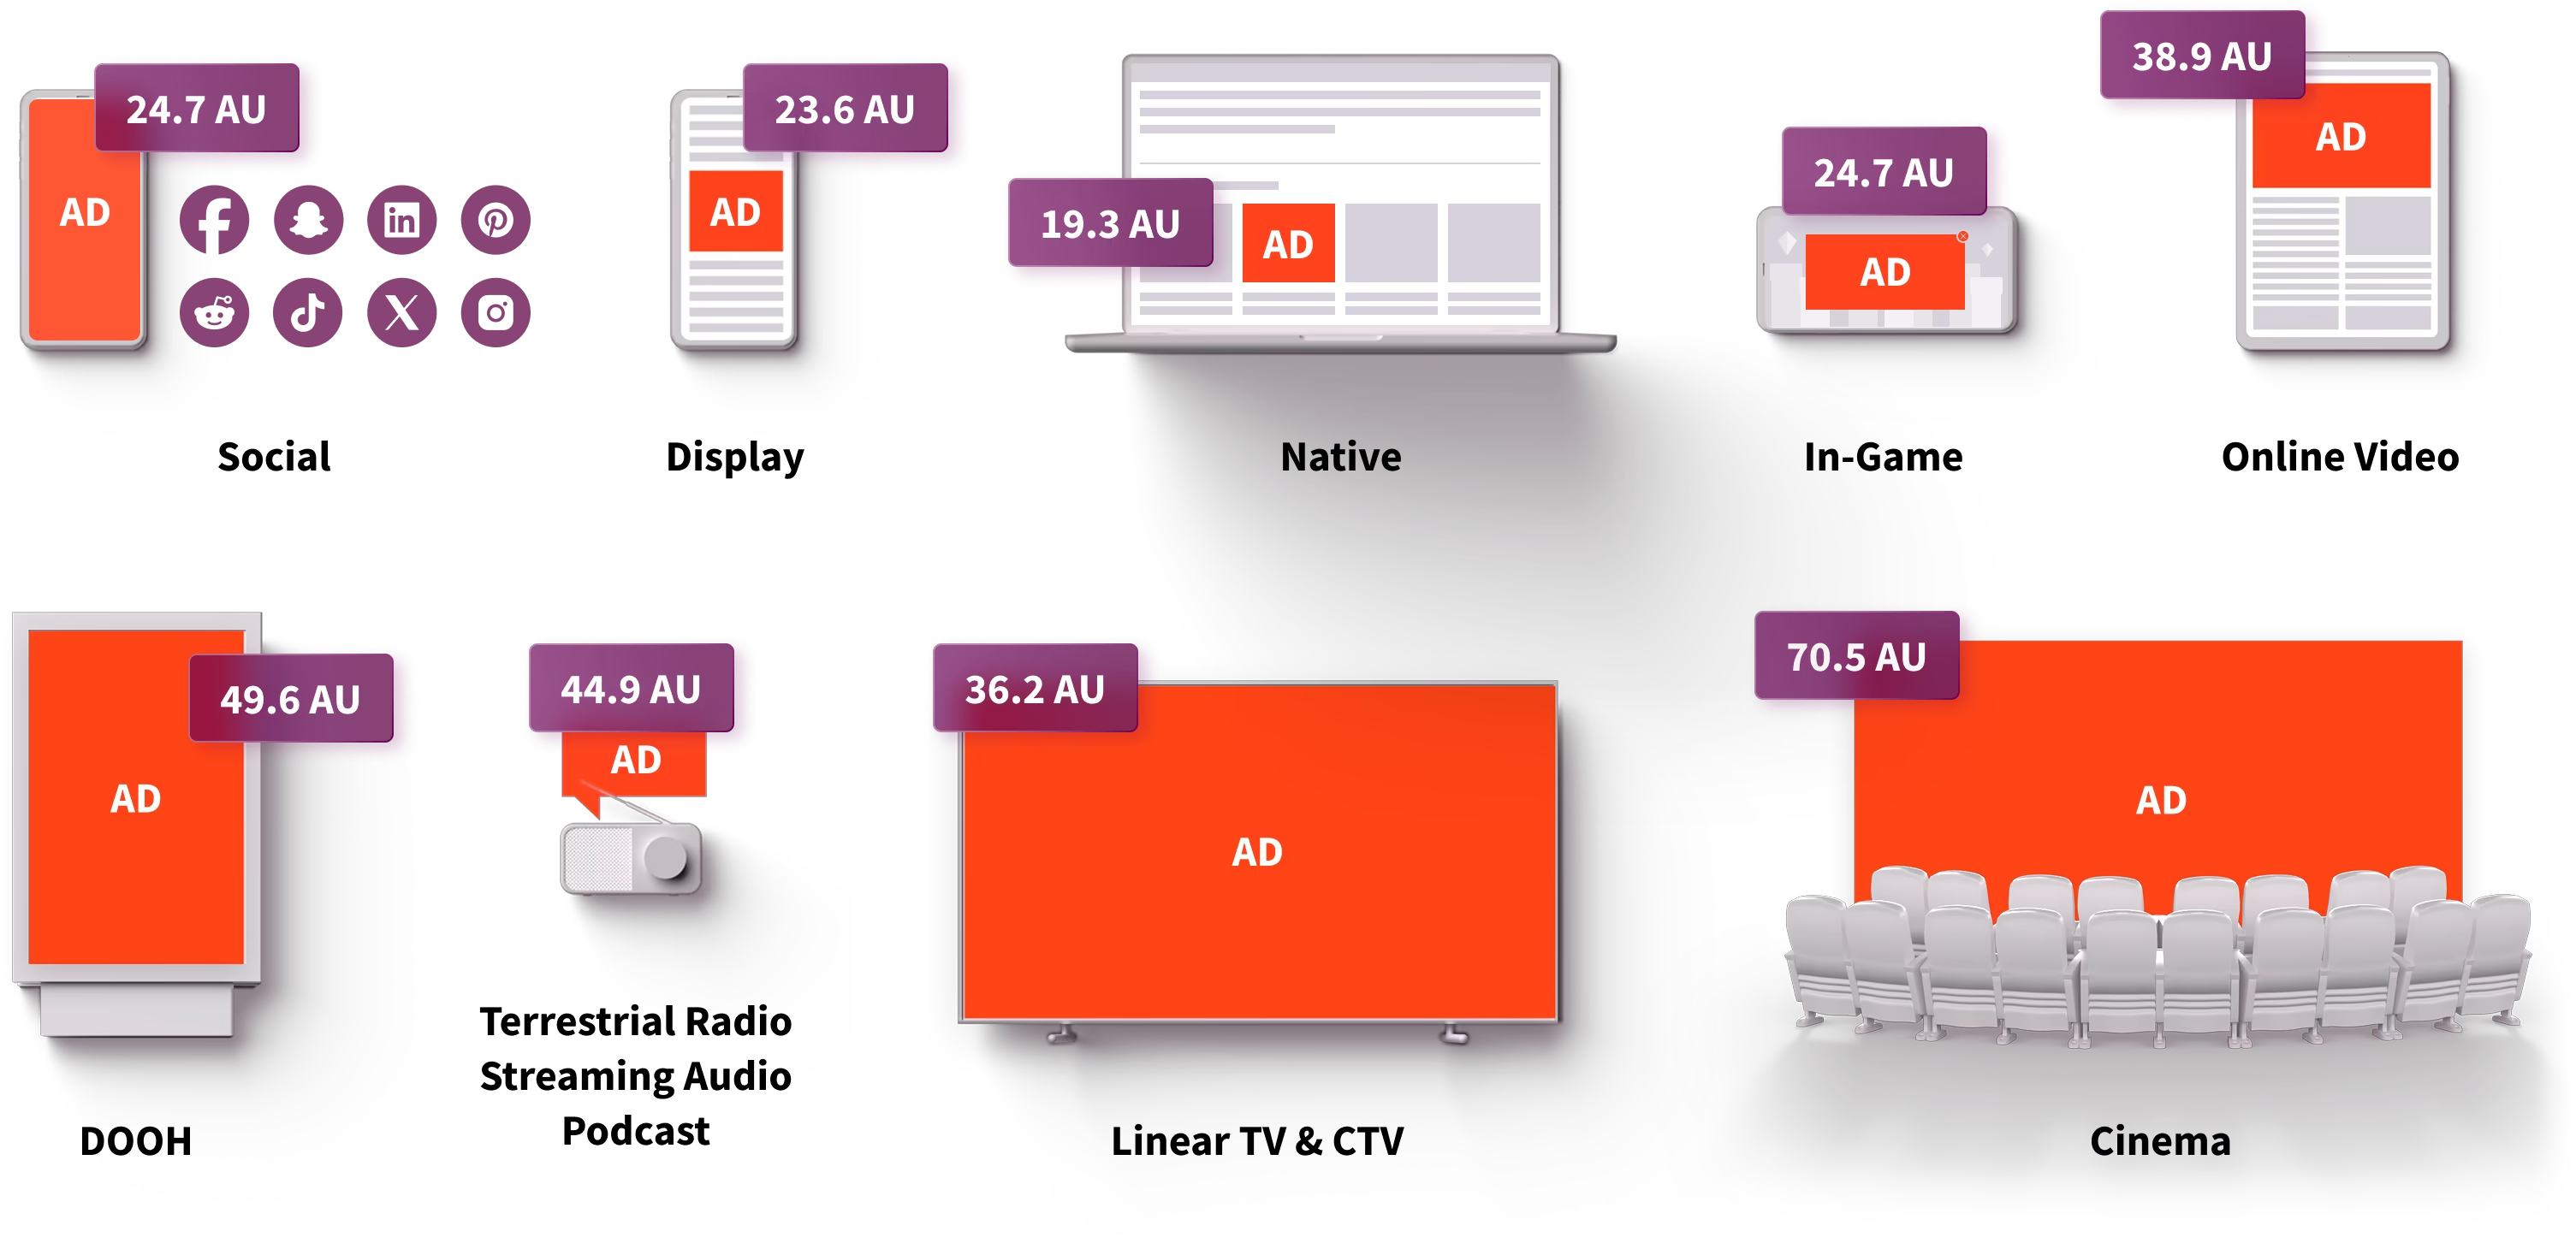
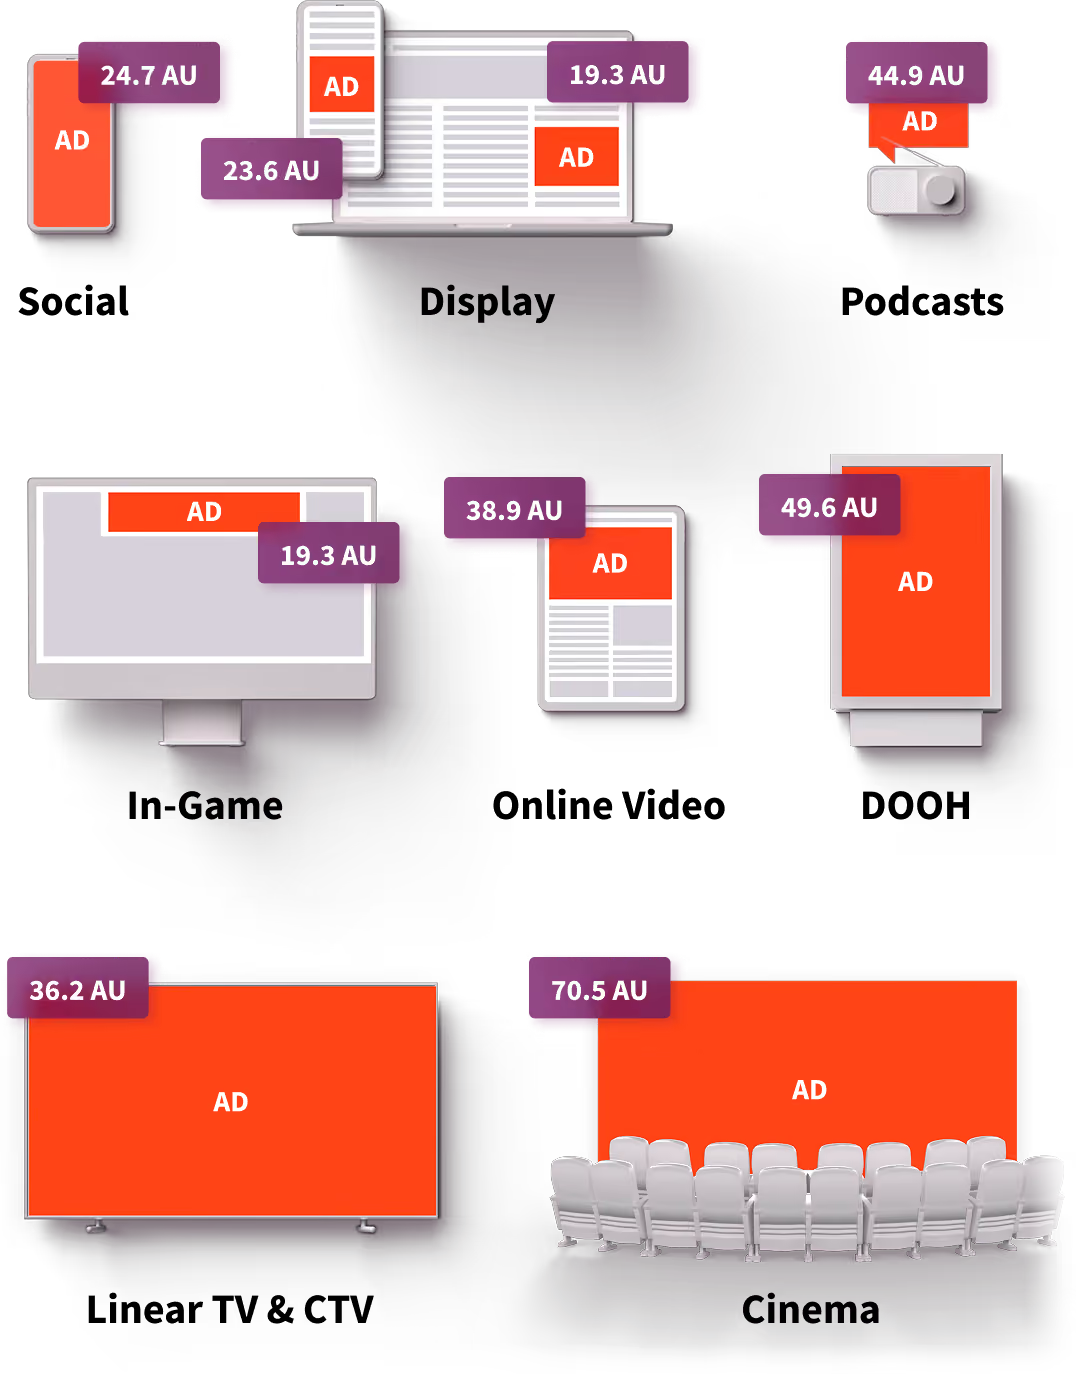
The same AU framework is normalized across 19 channels, including display, OLV, CTV, linear TV, social, audio, and DOOH, covering roughly 95% of a typical advertiser's media plan.
The Limitations of Impression-Level Attention for Media Optimization
Impression-level attention introduces trade-offs when used to evaluate or optimize media quality. Because Quality Attention incorporates user interaction and other impression-level signals, a higher score can reflect audience behavior, responses to creative, and exposure conditions in addition to media quality. That creates risk when buyers use it to guide investment.
IAS’s 1–100 scale gives buyers a simple way to compare attention levels, but public materials provide limited detail on how incremental changes in the score map to incremental business value. More importantly, optimizing campaigns for higher attention scores may favor impressions tied to stronger audience response or exposure conditions, without distinguishing how much of that advantage comes from the media placement itself.
The same issue carries into planning and measurement. Audience-driven variation can make the signal less reliable for deciding which media to invest in. In marketing mix modeling, that variability can also make the score less stable as a measure of media quality across campaigns and over time.
It also complicates media quality guarantees. Publishers can stand behind the characteristics of inventory they control, but not who sees an impression or how they respond. An impression-level score influenced by user behavior is therefore a flawed basis for transactions.
AU’s placement-level design addresses these issues by focusing on media-driven characteristics and separating media quality from specific audience and creative effects. This gives planners, buyers, and sellers a consistent signal for investment decisions, MMM, and quality-based transactions.
Independent Validation: Adelaide AU vs. IAS Quality Attention
Both Adelaide AU and IAS Quality Attention have undergone independent review, though the scope and publicly available documentation differ.
In the vendor-reported CESP 2026 Attention Grid, IAS indicates that Quality Attention has been independently audited and that PwC and Imperial College London cross-validated its predictive model; however, those reviews’ findings have not been made public. Quality Attention is not MRC accredited, although several of IAS’s underlying verification capabilities are.
Adelaide AU has completed the MRC’s pre-audit phase and is currently under review, making Adelaide the first pure-play attention vendor to enter the accreditation process.
Separately, MediaSense conducted an independent audit of Adelaide AU in 2025, examining both its methodology and its relationship to business outcomes. MediaSense independently reconstructed AU-to-outcome curves for Aided Awareness, Familiarity, Intent, and Recall and found statistically significant positive relationships between AU and all four measures. The review also found Adelaide’s methodology transparent, reproducible, and independently verifiable.
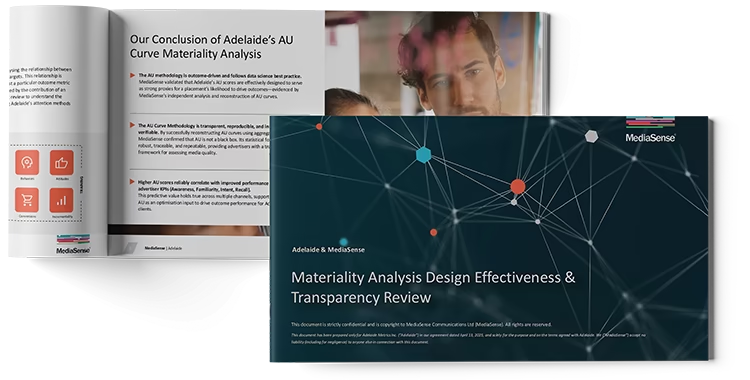
The clearest distinction is what has been demonstrated publicly. MediaSense directly tested whether changes in AU correspond to changes in advertiser outcomes and published its findings. In contrast, IAS’s public outcome evidence comes largely from its own research and case studies.
Channel Coverage and Activation Capabilities
Core Quality Attention covers open-web display, video, and mobile in-app. Beyond that, IAS relies on separate offerings. Social Attention Measurement, developed with Lumen, uses its own methodology, and some platforms, such as Snap, use bespoke scores. In CTV, IAS Total TV focuses on content transparency and verification rather than attention scoring. IAS’s attention coverage does not extend to linear TV, terrestrial or digital audio, DOOH, or cinema.
Adelaide has developed AU models for 19 channels, including display, OLV, CTV, social, linear TV, audio, DOOH, and cinema. The same normalized 0–100 framework applies across channels, giving advertisers a consistent way to evaluate media quality as investment moves across environments.
Both companies support programmatic activation. IAS activates Quality Attention through pre-bid segments, which buyers can use to target higher-attention impressions. Publishers and SSPs can also use Quality Attention data to create custom attention-based packages and PMP offerings.
Adelaide supports comparable pre-bid targeting and high-AU PMPs, plus custom bidding solutions that integrate AU directly into existing DSP workflows. AU is available across 125+ DSP, SSP, publisher, and platform integrations.
IAS Quality Attention vs. Adelaide AU: Comparison Table
Choosing Between Adelaide AU and IAS Quality Attention
The choice between Adelaide AU and IAS Quality Attention depends on the role the metric is expected to play. For advertisers already using IAS verification, Quality Attention adds an impression-level view of attention within the same measurement ecosystem. However, its reliance on audience behavior and exposure conditions makes it a risky signal for evaluating and optimizing media quality.
Adelaide AU offers a single omnichannel media quality signal that advertisers can use across planning, buying, optimization, and measurement. Its placement-level approach also gives sellers a consistent basis for quality guarantees.