
Adelaide vs. Lumen Research: How Our Attention Measurement Approaches Differ

Lumen’s approach centers on the duration of attention, predicting whether someone looked at an ad and for how long by combining eye-tracking and viewability data. Adelaide takes a different approach with AU, a 0–100 media quality score. It uses eye-tracking data as one input alongside placement, device, and outcome data to predict a media placement’s likelihood of capturing attention and contributing to a business outcome.
Those design choices have practical implications. Attention duration is heavily influenced by creative and audience, while AU is designed to evaluate the quality of the media opportunity independent of those factors.
How Lumen Research Measures Attention Duration
Lumen's core metric is APM, or Attentive seconds Per Mille, which attempts to predict how many seconds of attention an ad receives for every thousand impressions.
Lumen has collected over 650,000 eye-tracking sessions since 2013 through a small desktop and mobile panel in the UK and US. Its Predictive Attention Engine combines that eye-tracking research with device signals to predict attention duration at scale.
Lumen applies these predictions through LAMP, its measurement and planning platform; Lumen Attention Bidding, a real-time DSP bidding algorithm; and Lumen Loop, its activation solution that creates attention duration targets for campaign-specific PMPs.
APM is categorized as a duration-based attention metric, or DBAM. We will cover the limitations which emerge when used as a media quality signal or optimization target later.
How Adelaide AU Measures Media Quality
Adelaide created AU to answer a different question: whether a media placement creates a strong advertising opportunity. AU is a 0–100 media quality score trained and validated against real business outcomes, such as conversions, brand lift, and revenue. It combines eye-tracking research from providers including Lumen, Tobii, TVision, and Amplified Intelligence with placement- and device-level signals and outcome data.
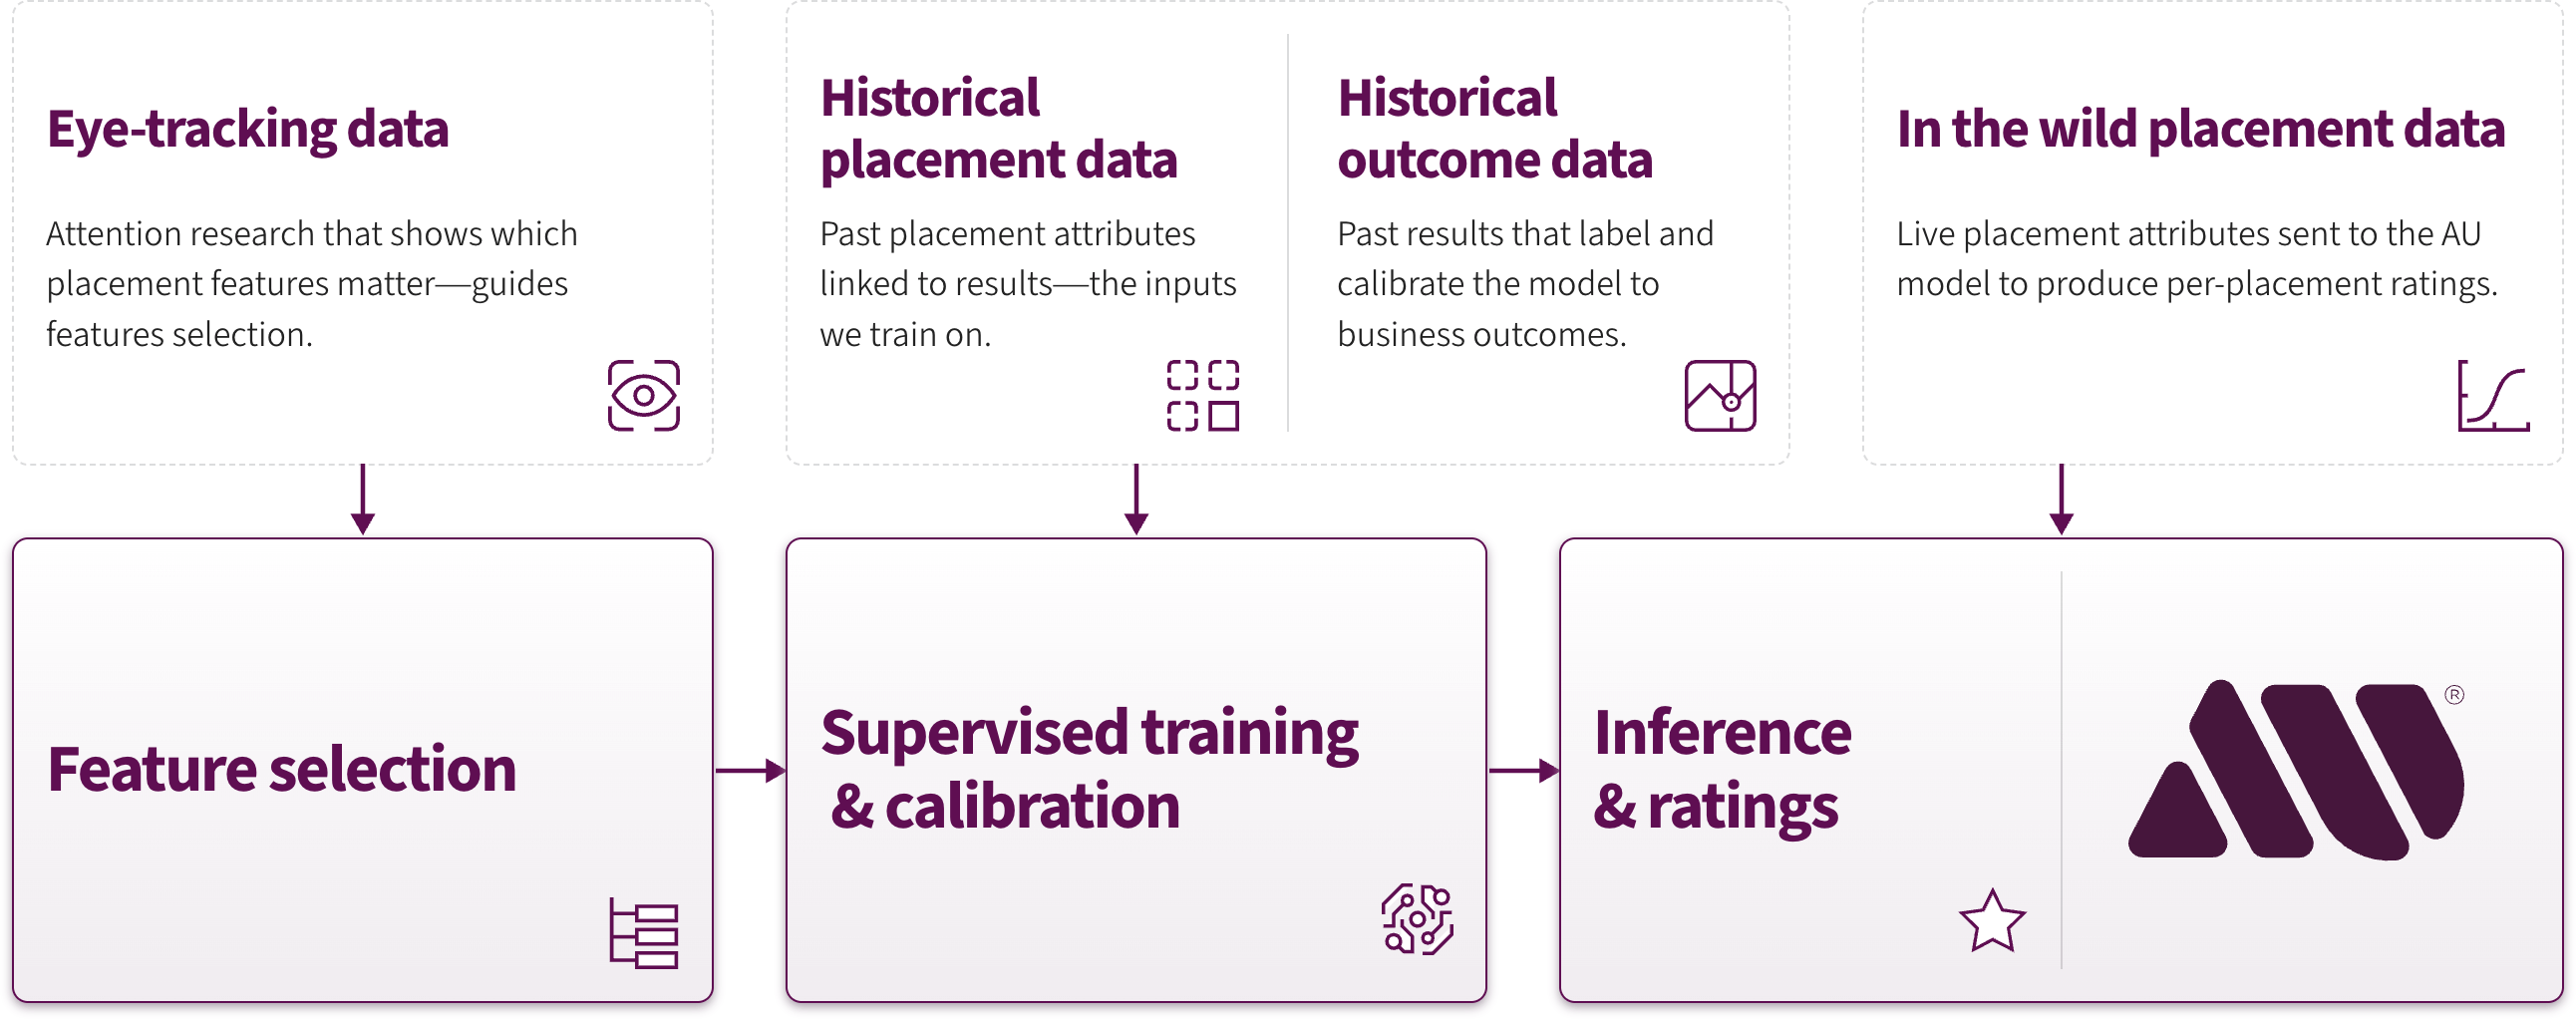
That broader input set allows AU to account for more than gaze duration, including the characteristics of the media environment and the outcomes it is positioned to support. AU uses those signals to measure a placement’s likelihood of capturing attention and contributing to impact.
Because AU evaluates media quality at the placement level, it reflects the quality of the media opportunity itself rather than the combined effects of the environment, creative, and audience. The result is a normalized 0–100 framework that marketers can apply consistently across all 19 channels Adelaide measures, including CTV, linear TV, social, display, and online video (OLV).
The Limitations of Optimizing Toward Attention Duration
Attention duration reflects more than the quality of a media placement. It is also strongly influenced by the creative and the audience viewing it. Because duration is shaped by media, creative, and audience factors, optimizing toward it effectively pulls all three levers at once. A campaign can increase its attention-duration score by changing creative or shifting audience delivery, even if the underlying media quality has not improved.
Some creative naturally holds attention longer than others. An ad that is surprising or visually complex may generate more attentive seconds without necessarily delivering greater business impact.
Audience characteristics influence duration too. Research shows that older and brand-aware consumers tend to spend more time with ads. This creates what Adelaide describes as the Attentive Audience Paradox, where optimizing for attention duration can skew delivery toward people already predisposed to pay attention, potentially at the expense of audiences with more room to move.
Duration also assumes that more seconds mean more value. But attention has diminishing returns. The tenth second, for example, is not necessarily ten times as valuable as the first. And seconds do not carry the same meaning across channels. Five seconds on a display ad represents a different advertising experience than five seconds on OLV or CTV, making attention duration difficult to compare consistently across a media plan.
Don’t be fooled by retrospective studies that demonstrate a correlation between duration and outcomes. It’s true that the placements which capture the most attention will likely drive the most efficient outcomes. However, that correlation holds only while nobody is optimizing for it. Once duration becomes the target, buyers select for whatever drives seconds up, whether or not it drives results up, and the correlation breaks down.
Creative, audience, and cross-channel differences all move the number without moving media quality. Duration measures how long someone looked, not whether the placement was worth buying.
Independent Validation
Both companies have had their methodologies independently reviewed, though the scope and findings of those reviews differ.
PwC reviewed Lumen's methodology in 2023, including its predictive models and their relationship with campaign performance. The review found that Lumen’s model predicted whether an impression was viewed with 70% accuracy in a sample that was 88% banner ads. Surprisingly, this report also included a brand-lift analysis in which Lumen's attention metric underperformed viewability across all seven brand-lift outcomes.
MediaSense audited AU in 2025, evaluating Adelaide’s scoring methodology and AU Curve Materiality Analysis, which helps advertisers understand how changes in AU relate to campaign outcomes. MediaSense independently reconstructed the curves across Aided Awareness, Familiarity, Intent, and Recall, then tested the relationship between AU and each outcome. The review found statistically significant positive relationships across all four KPIs, with higher AU associated with stronger performance. MediaSense also found the methodology transparent, reproducible, and independently verifiable, and concluded that Adelaide’s modeling approach aligns with IAB and MRC recommendations and data science best practices.
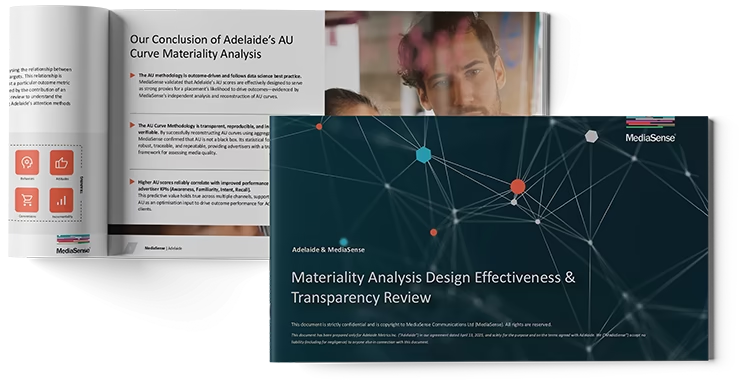
AU is also under MRC review for accreditation, making Adelaide the first pure-play attention vendor to achieve this status.
Activation and Real-Time Bidding
Both companies offer activation, but their approaches and footprints differ.
Lumen’s activation products rely on custom, campaign-specific setup. Attention Bidding uses a brand-specific attention model integrated into select DSPs, while Lumen Loop uses historical campaign data to set attention targets activated through PMPs. Both operate within a narrower activation footprint than AU.
AU can be activated through pre-bid targeting and suppression, high-AU PMPs, and custom bidding algorithms. Today, AU spans 125+ integrations across major DSPs, SSPs, publishers, and other media platforms, with off-the-shelf activation widely available.
The methodological differences carry into activation. Lumen’s solutions optimize for predicted attention duration, while Adelaide’s prioritize higher-quality media.
Lumen Research vs. Adelaide Comparison
When To Pick Adelaide AU or Lumen APM
Pick Lumen APM when the primary goal is to estimate how long an ad holds attention. APM supports attention measurement, but creative and audience heavily influence duration. This makes APM a misleading target for media optimization and an imprecise measure of media quality.
Pick Adelaide AU when the goal is to evaluate, compare, or optimize media quality. AU combines attention data with placement and outcome data to score a media opportunity’s likelihood of capturing attention and contributing to business results.
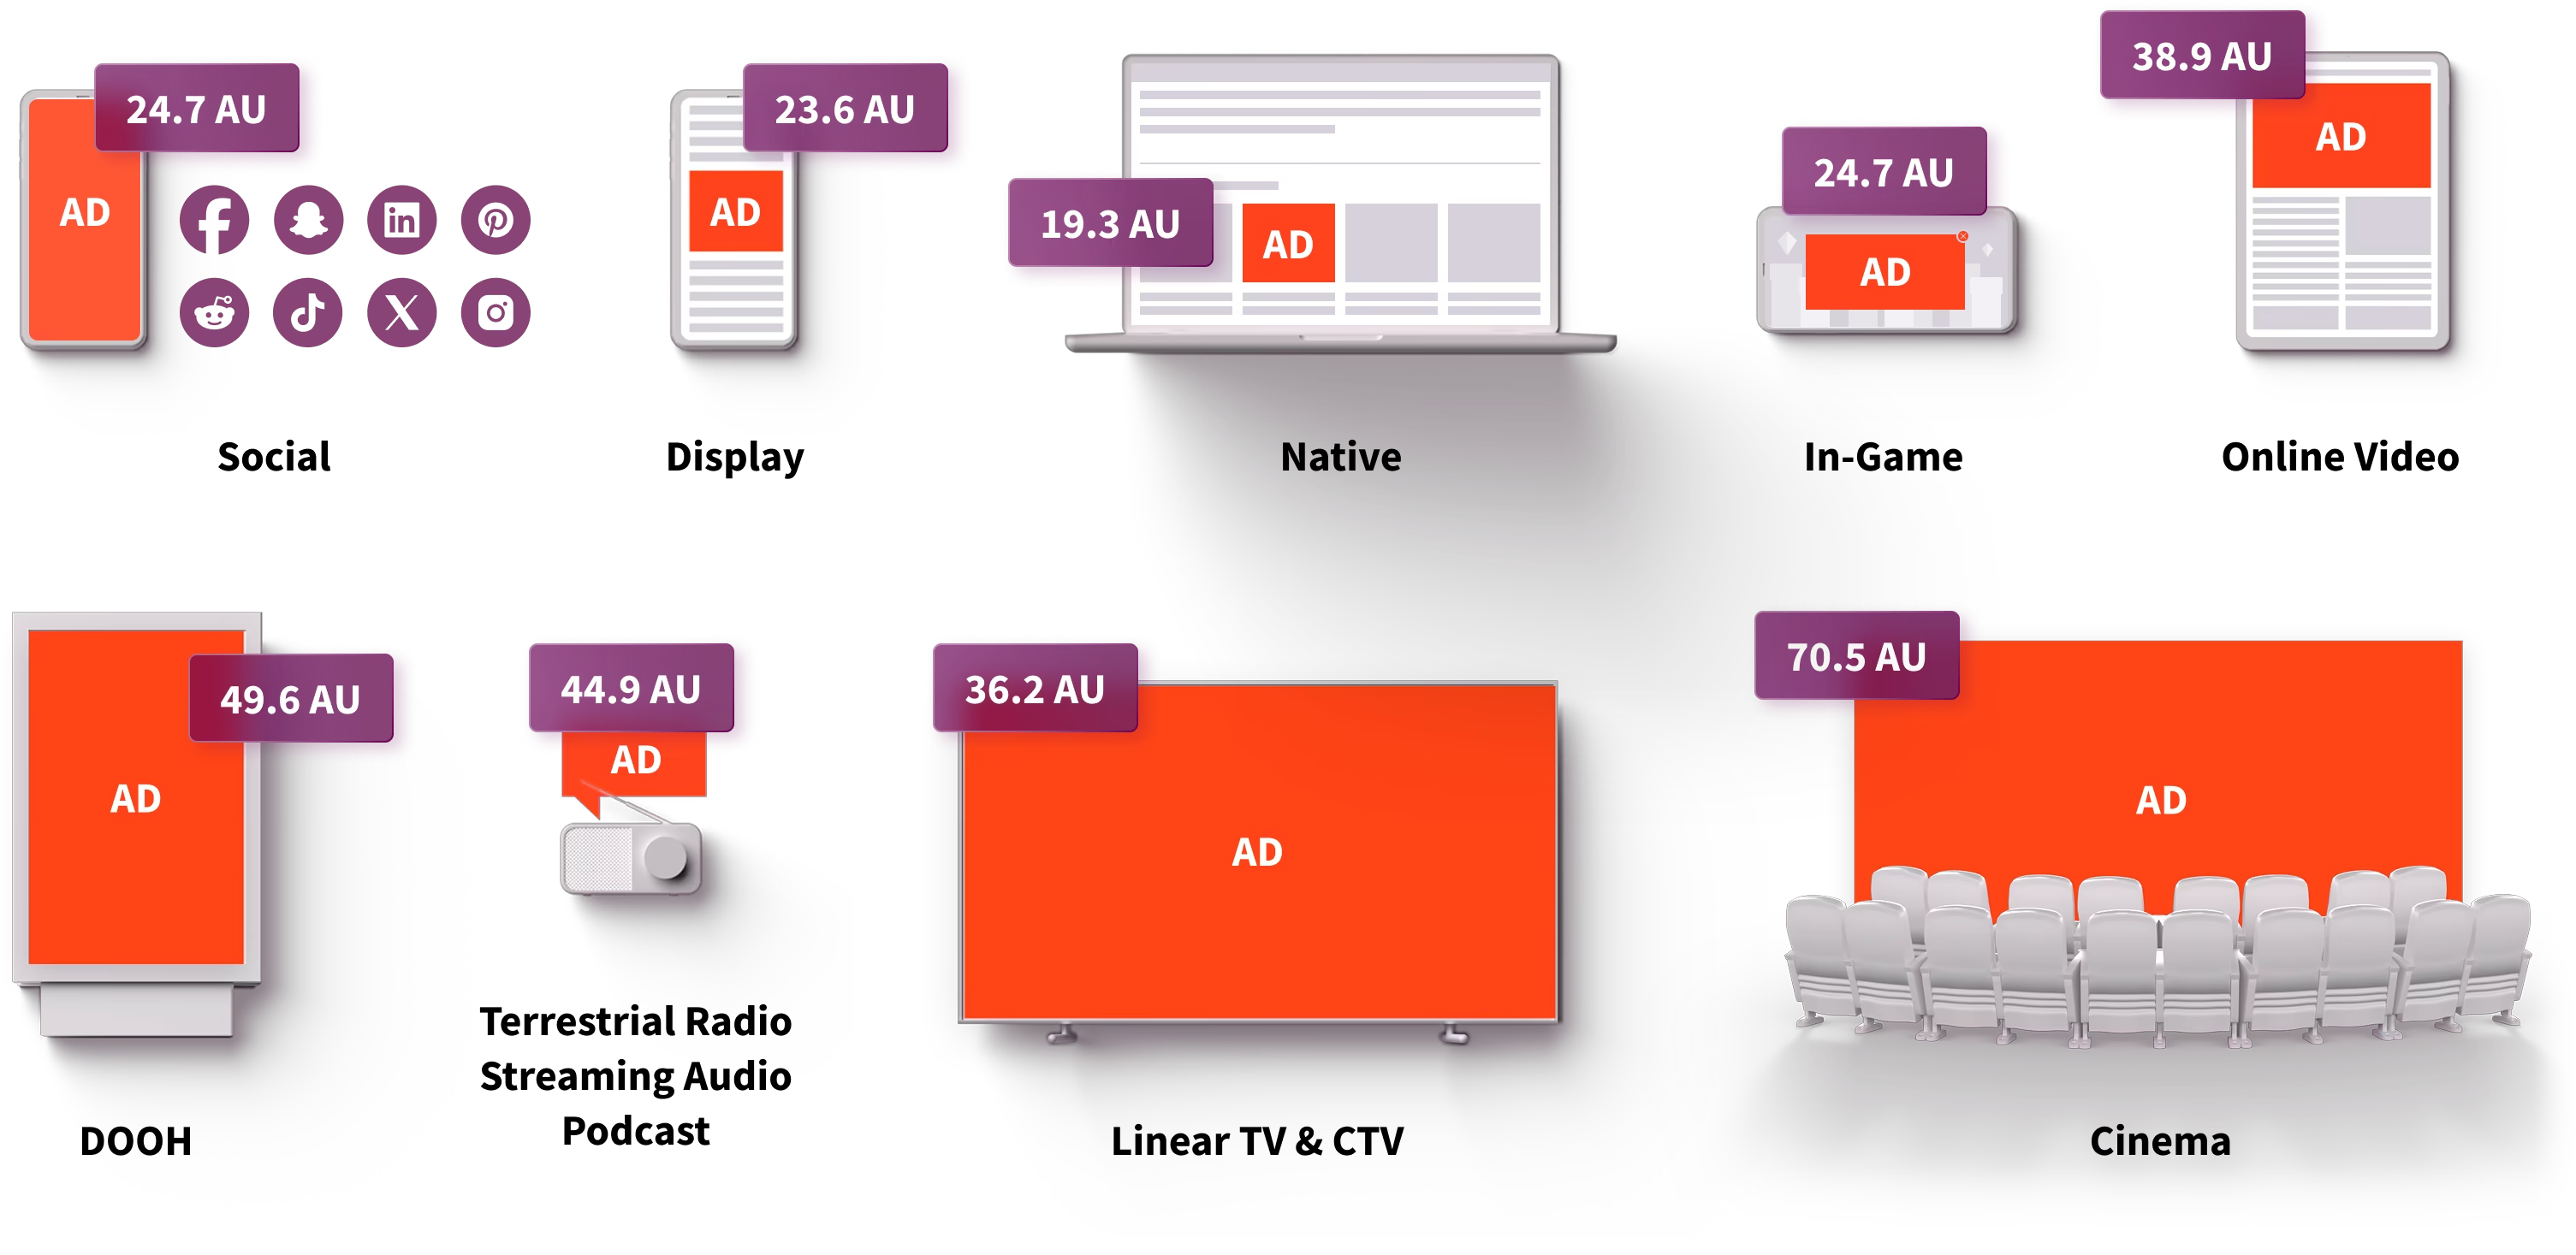
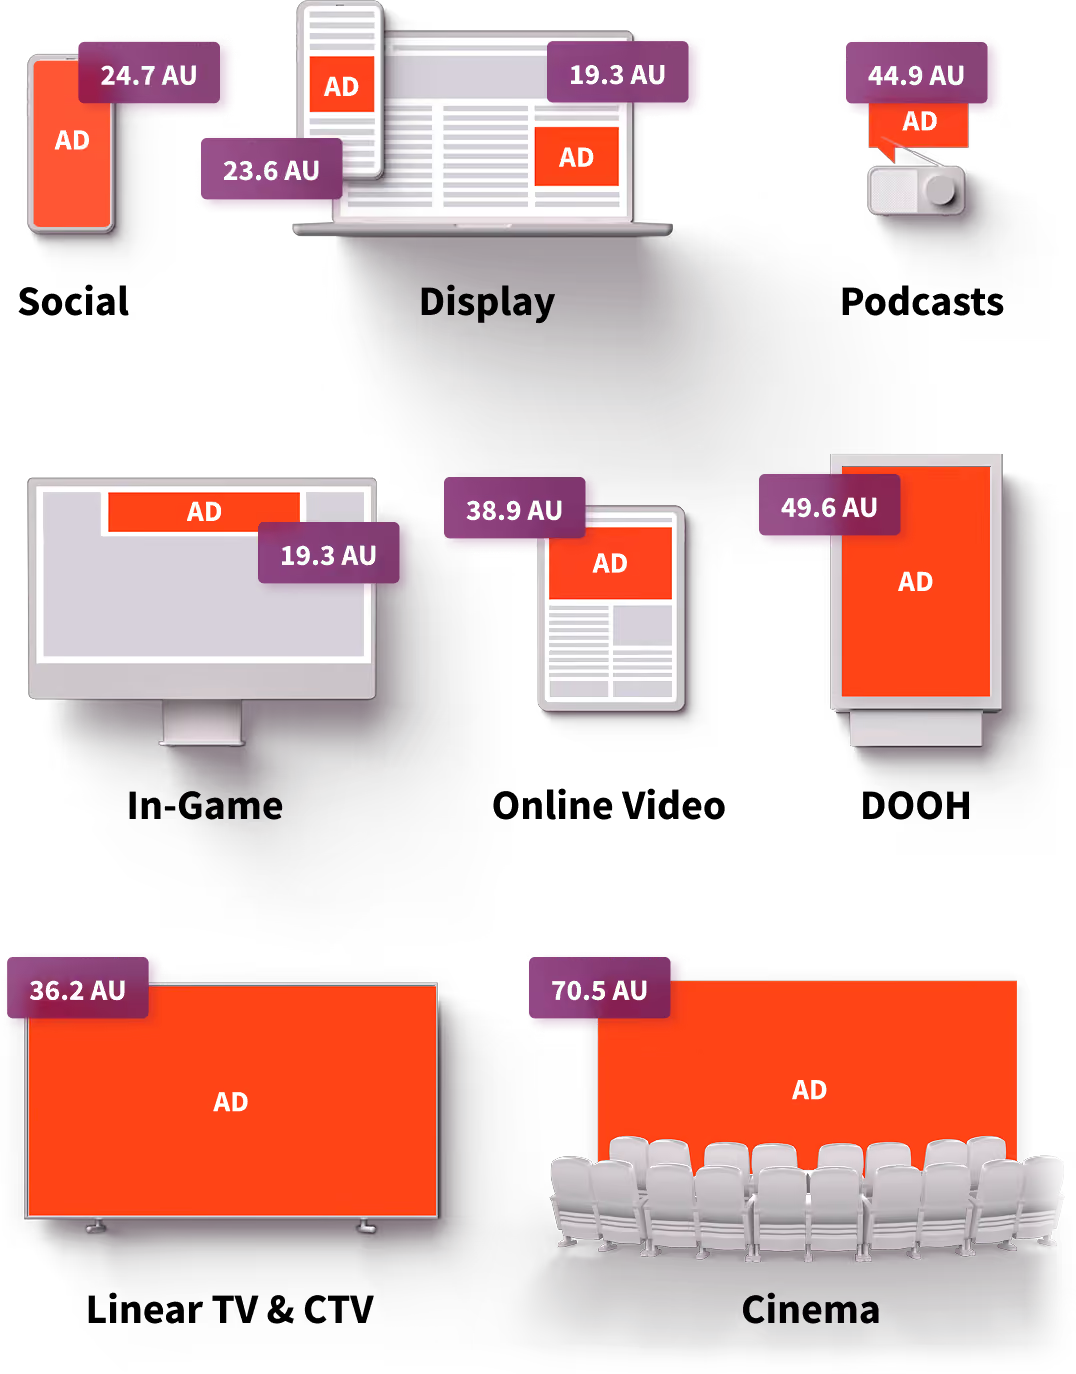
For planning and buying decisions, AU provides the more actionable signal. Its normalized 0–100 score allows advertisers to compare media quality across channels and activate against higher-quality placements.