
Beyond Viewability and Duration: How To Measure Media Quality Across Display and OLV With AU

This fragmentation makes it difficult for advertisers to understand the quality of the reach they are buying across partners, formats, and placements. It also creates a challenge for premium publishers, which must compete with high-volume environments while maintaining the lower ad loads and stronger consumer experiences that quality advertising requires.
Common hygiene metrics provide only part of the picture. Viewability indicates whether an ad had the opportunity to be seen—at least partially and for a minimum period of time. But two equally viewable impressions can differ substantially in their placement characteristics and potential to drive impact.
Video completion rate, or VCR, has a similar limitation. It confirms that a video played to a certain point, but not the quality of the environment in which it appeared or whether the placement contributed to an outcome.
Used in isolation, these metrics can reward environments that maximize a single delivery signal without creating the conditions for advertising to work. They cannot fully show whether a placement is setting the creative up for success or how its quality compares across formats and channels.
This is the problem Adelaide built AU to solve.
What Is Adelaide AU?
AU is a 0–100 media quality rating that predicts a placement’s ability to capture attention and drive business outcomes. It combines placement and device signals, eye-tracking research, and full-funnel outcome data to evaluate the environment in which an ad is served.
Because AU is normalized across channels, advertisers can assess quality within display and online video inventory while also comparing those investments with CTV, social, audio, and the rest of the media plan.
How Adelaide Generates Display AU Scores
Adelaide develops AU models through four core steps.
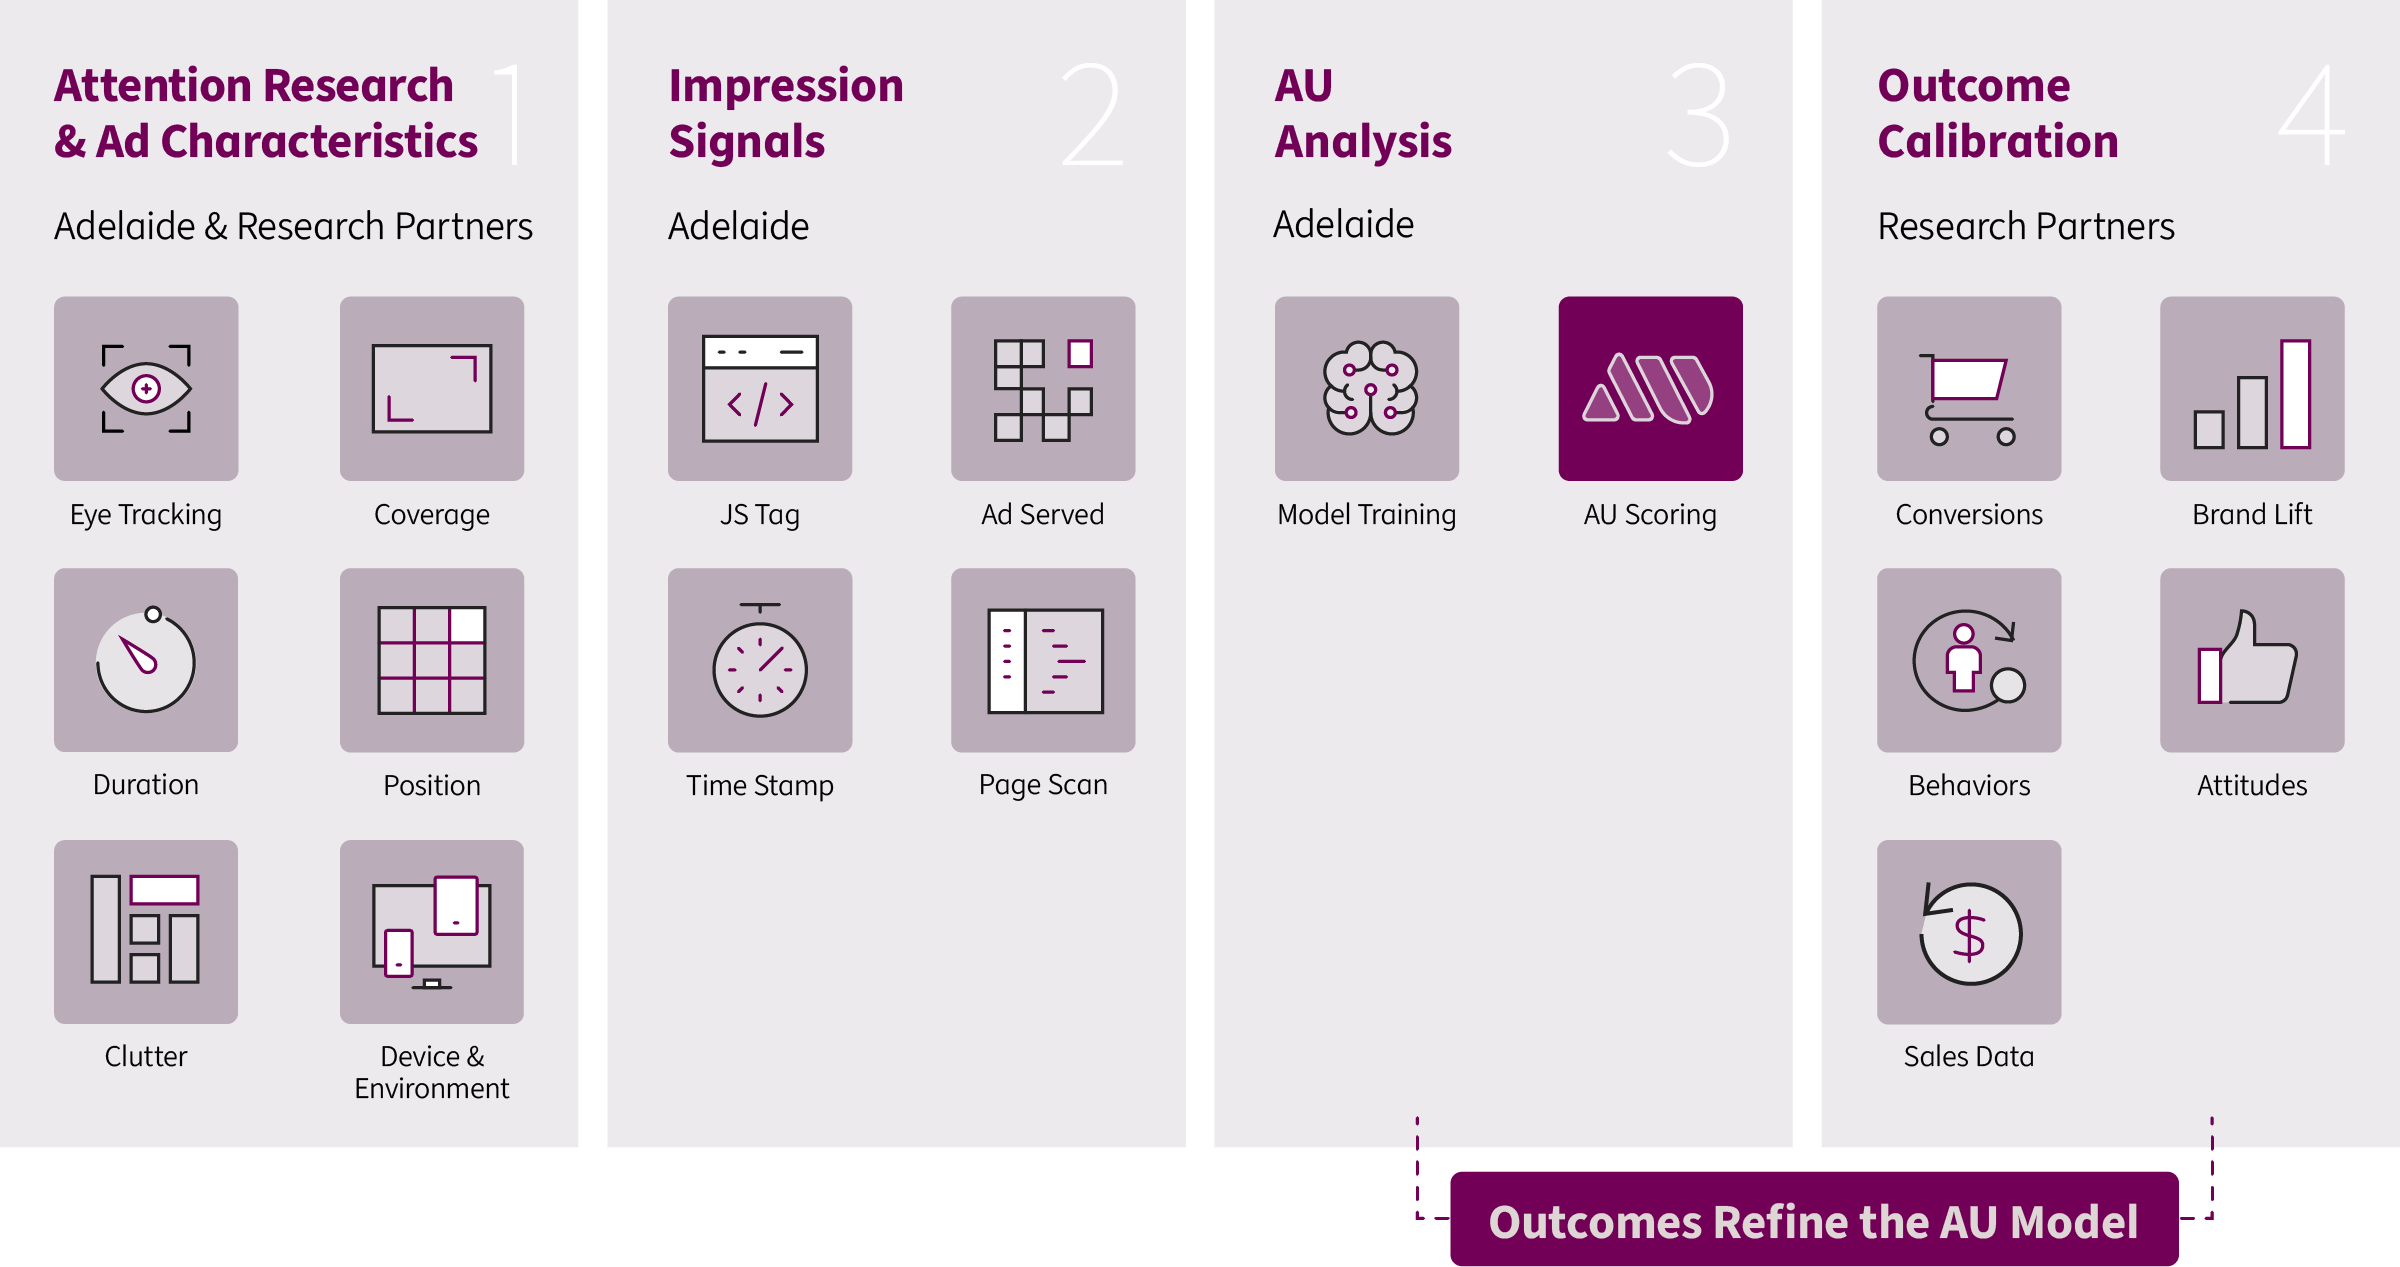
First, attention research and eye-tracking studies identify the placement characteristics associated with capturing attention. For display advertising, these include:
- Coverage: How much of the ad is visible on screen
- Duration: How long it remains in view
- Position: Where it appears on the page
- Clutter: How much surrounding content and advertising compete for attention
- Device and environment: The context in which the impression is served
Second, Adelaide gathers these media quality signals across placements at scale. A JavaScript tag trafficked alongside the creative captures a real-time snapshot of the placement and surrounding environment as the ad renders.
Adelaide also uses page-scanning technology to continuously analyze how ads render across domains, expanding its understanding of display inventory beyond impressions observed through live campaigns.
Third, Adelaide combines these placement characteristics in an initial model to generate preliminary AU ratings.
Finally, the model is trained and calibrated using historical outcome data tied to the placements being evaluated, including brand lift, behavioral signals, conversions, and sales.
The result is a media quality rating that reflects a placement’s ability to create the conditions for advertising impact. Attention is not the end goal. Quality media should help creative capture attention, communicate its message, and influence an outcome.
How Adelaide Measures OLV Media Quality
Adelaide measures OLV using the same foundation as display, with additional inputs specific to video advertising environments.
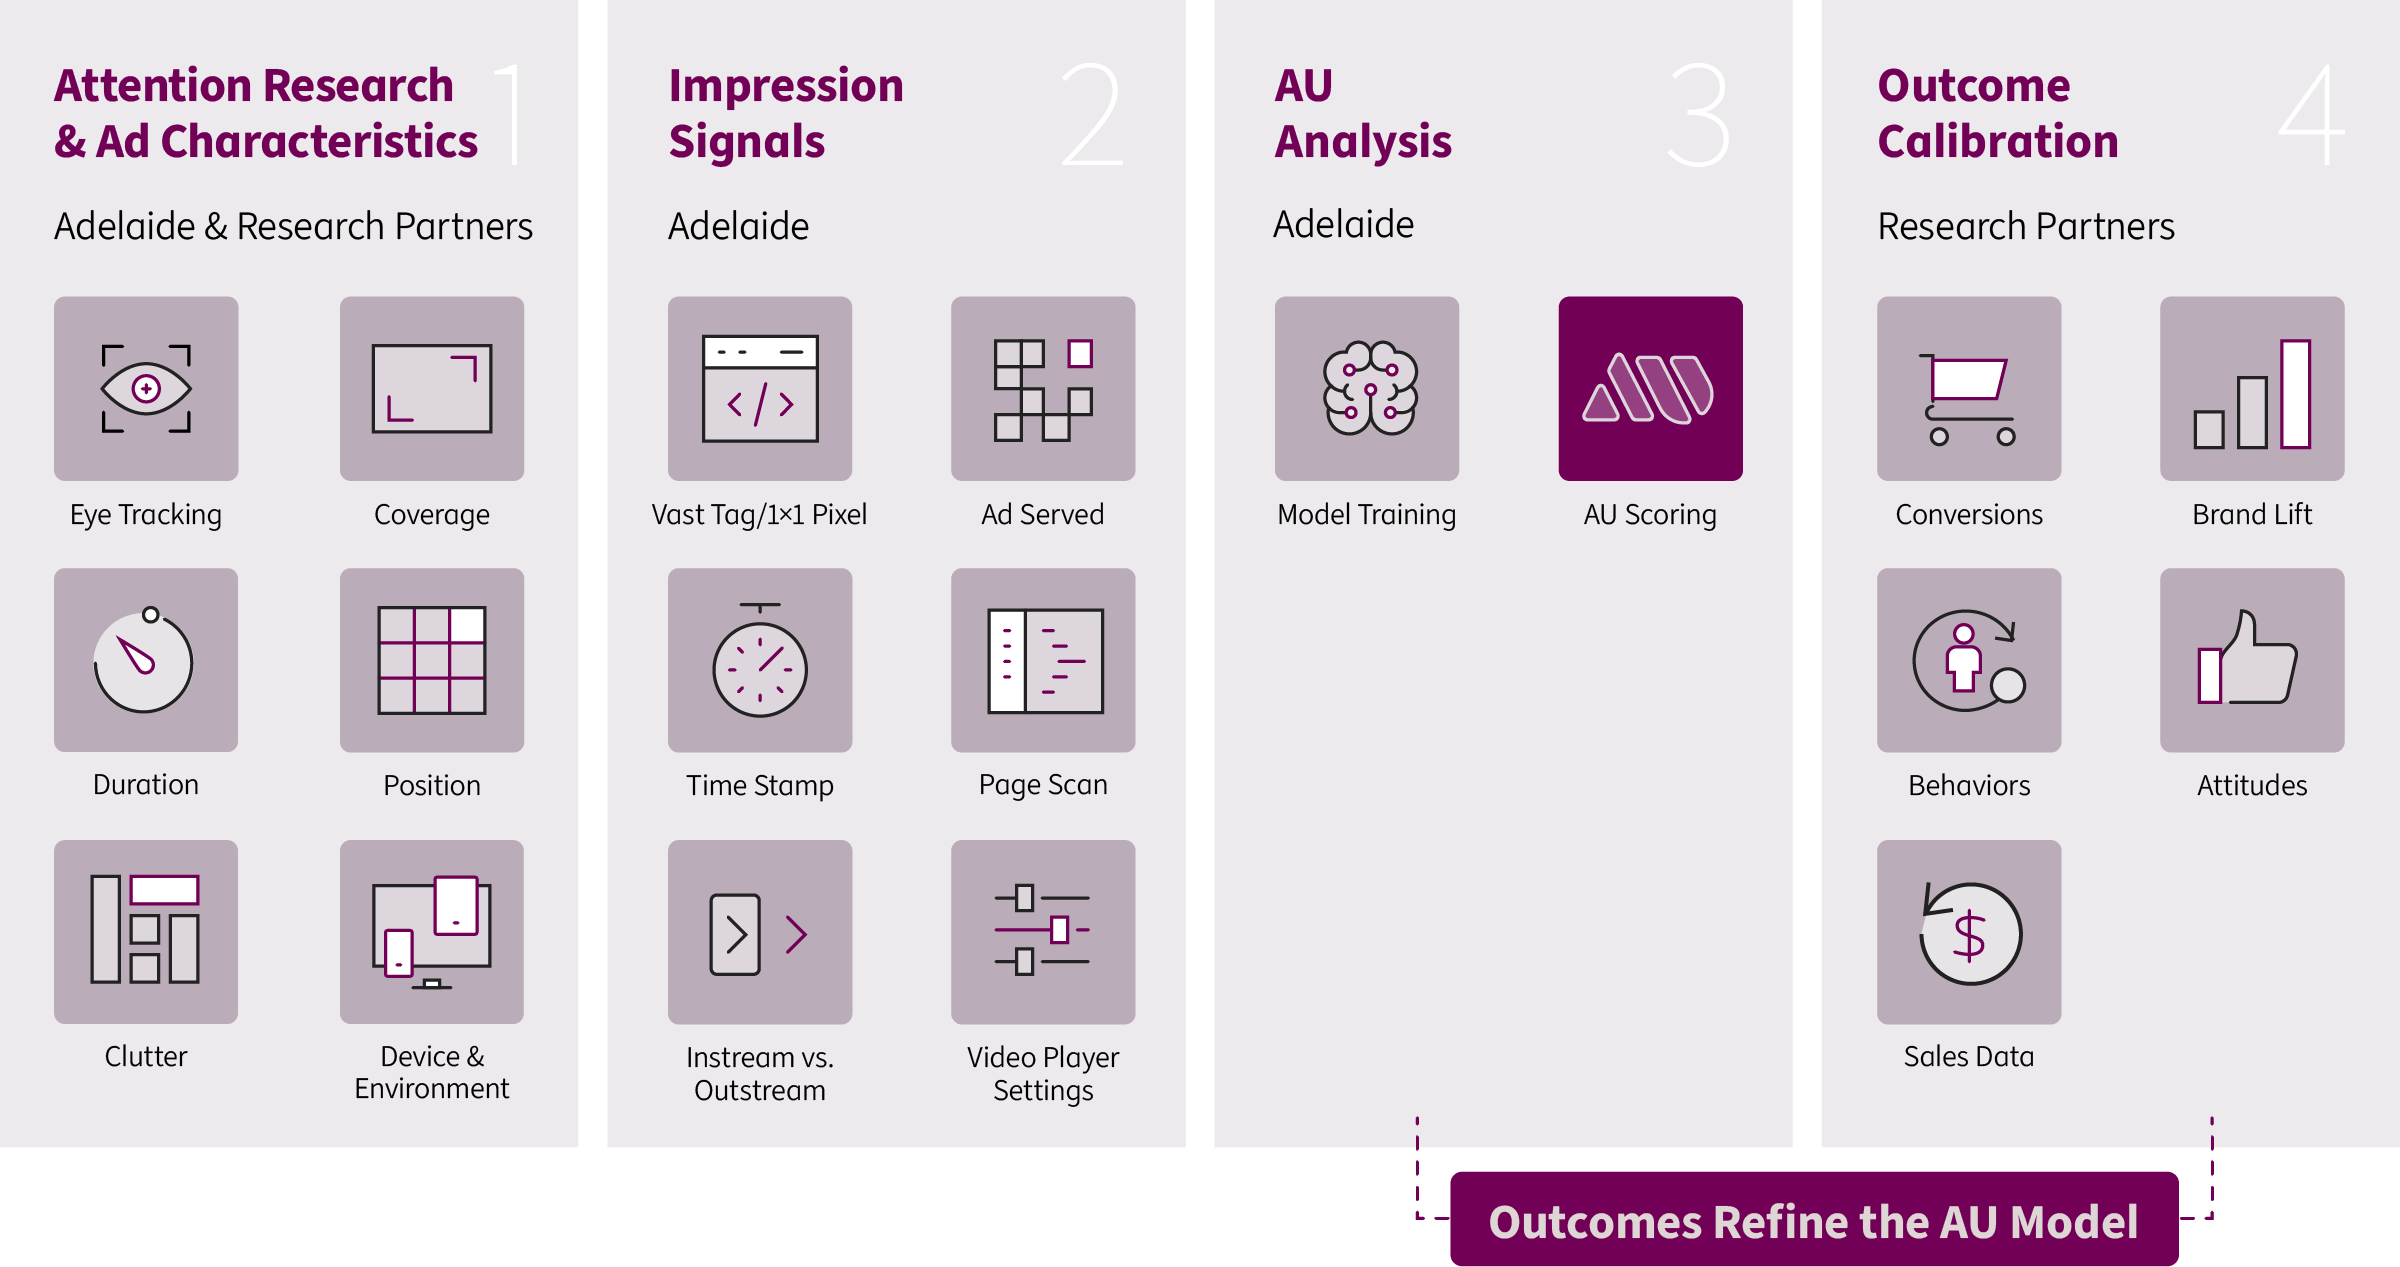
Adelaide's VAST tag and accompanying 1x1 pixel capture many of the same placement characteristics measured in display, along with video-specific factors such as audibility and player type.
These signals account for meaningful differences between:
- In-stream and outstream video
- Autoplay and user-initiated playback
- Sound-on and sound-off environments
- Prominent players and video surrounded by competing content
By evaluating these characteristics together and calibrating the model against full-funnel outcome data, AU provides a more complete view of OLV media quality than VCR or viewability alone.
A Privacy-Friendly Approach to Media Quality Measurement
Across channels, AU connects ad exposures and placement signals to outcomes without relying on user-based identifiers, cookies, or personally identifiable information. It evaluates the quality of the media environment—not the creative it contains or the audience it reaches.
Eye-tracking data is collected through fully opted-in panels, either licensed from third parties or generated through Adelaide’s own research.
By focusing on placement-level media quality rather than individual users, AU offers a durable, privacy-friendly approach to digital advertising measurement.
What Higher-AU Media Delivers
Across industries and media strategies, higher-AU placements are consistently linked to stronger business outcomes:
- An electronics and technology brand found that its highest-AU display placements generated 3x more conversions than its lowest-AU media. Notably, the placements with the highest viewability had the lowest AU ratings and weakest conversion performance.
- A global bank increased display conversions by 2.8x while reducing cost per acquisition by 69% by optimizing toward higher-AU media.
- Fitness brand iFIT found that activating AU pre-bid segments in The Trade Desk increased aided awareness by 61% and consideration by 18% compared with the control group.
- Diageo found that high-AU display placements delivered through Amazon DSP drove nearly 2.5x greater sales impact than low-AU media.
- A CPG brand saw 3.4x more in-store purchases from high-AU OLV placements versus low-AU inventory.
More results are available in the 2026 Adelaide Outcomes Guide.
Download the Display and OLV Measurement Overview to learn more about how Adelaide evaluates media quality across the web.