The 2026 
Outcomes Guide

Our most popular report for a reason.

Get the Guide

Why thousands of marketers come back every year

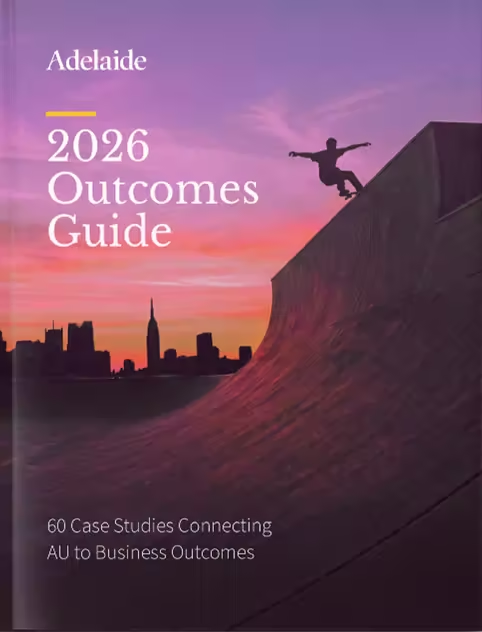
More than 3,000 media and marketing professionals download the annual Outcomes Guide to see how attention is being used today—what’s changing, what’s working, and where it’s driving results.

The guide has become a trusted resource for teams at every stage of adopting attention, from evaluating it as an outcome-based alternative to legacy metrics to integrating it more deeply into media strategies.

What sets the guide apart

  • A clear look at how attention performs in real campaigns
  • Actionable takeaways teams can use right away
  • Easy navigation—explore all 60 case studies or filter by industry
  • A snapshot of how attention has evolved and what’s coming next
Adelaide solves one of the biggest problems brands face today: understanding the quality of the media they are investing in.”
Ron Amram
Sr. Director, Global Media,
Mars
We look forward to the Outcomes Guide every year. It gives concrete examples of how brands leverage attention metrics, helping us refine our own approach across planning and buying.”
Kalli Chapman
VP, Head of  Global Media & Sponsorships,
Prudential Financial
Trusted By

What’s inside the most downloaded attention guide:

60
Real-world
campaigns
16
Industries
represented
34
KPIs lifted by
attention metrics

Proof, not promises

Adelaide’s omnichannel media quality metric, AU, is trained to predict full-funnel outcomes—from awareness to sales.

The Outcomes Guide brings that connection to life, showing how attention metrics drive superior results across brands, industries, and objectives.

Read the guide

Across campaigns, brands using AU see, on average:

33%
Lift in Upper-Funnel KPIs
53%
Lift in Lower-Funnel KPIs

Unlock the strategies behind results like these:

Financial Services
+97%
Lift in unaided awareness
CPG
+108
Lift in ad recall
Food & Beverage
+121%
Lift in brand favorability
Automotive
+4.6x
Higher conversion rate
Travel
+83%
Higher booking rates
media & Entertainment
+52%
Stronger ROAS
E-Commerce
+6.3x
More revenue per impression
Energy & Utilities
45%
Lower cost per acquisition
See why it’s our most popular guide

Beyond the case studies

In addition to 60 examples of attention in action, the guide includes:

The top 10 ways advertisers use attention metrics today, from planning through activation

15 key shifts shaping attention in 2026, including what’s changed since last year

Dozens of practical strategies and takeaways you can use across channels and KPIs

Read the guide

Want to learn more about how AU drives better results? Read our free attention guides.