
Beyond Impressions and GRPs: How To Measure Media Quality Across CTV and Linear TV With AU

But as buying has evolved across linear TV, streaming, and CTV environments, measurement still often stops at delivery: how many people could have been reached, whether an ad played to completion, or how efficiently impressions were delivered.
GRPs remain useful for understanding linear TV reach, while impressions and completion rates help confirm CTV delivery. But none of these metrics tell advertisers whether a placement or ad spot had a strong opportunity to capture attention, influence perception, or drive business outcomes.
Brands and agencies need a way to understand which TV impressions are most likely to make an impact. That’s where AU can help.
AU is Adelaide’s attention-based media quality metric. It measures the likelihood that a placement will capture attention and contribute to outcomes across 19 channels, including CTV and linear TV. Each AU score reflects the media environment where an ad appears, whether that’s a CTV ad slot, linear TV spot, display placement, online video (OLV) placement, podcast spot, or another paid media context.
AU scores range from 0 to 100 and are normalized across channels, allowing advertisers to compare media quality across their full plan. AU uses a consistent methodology while accounting for the placement characteristics that influence attention and impact in each environment.
Here's how AU works across CTV and linear TV.
How Adelaide Measures Media Quality in CTV
To measure CTV media quality, AU combines impression-level delivery data, contextual signals, viewing-behavior research, and outcome calibration.
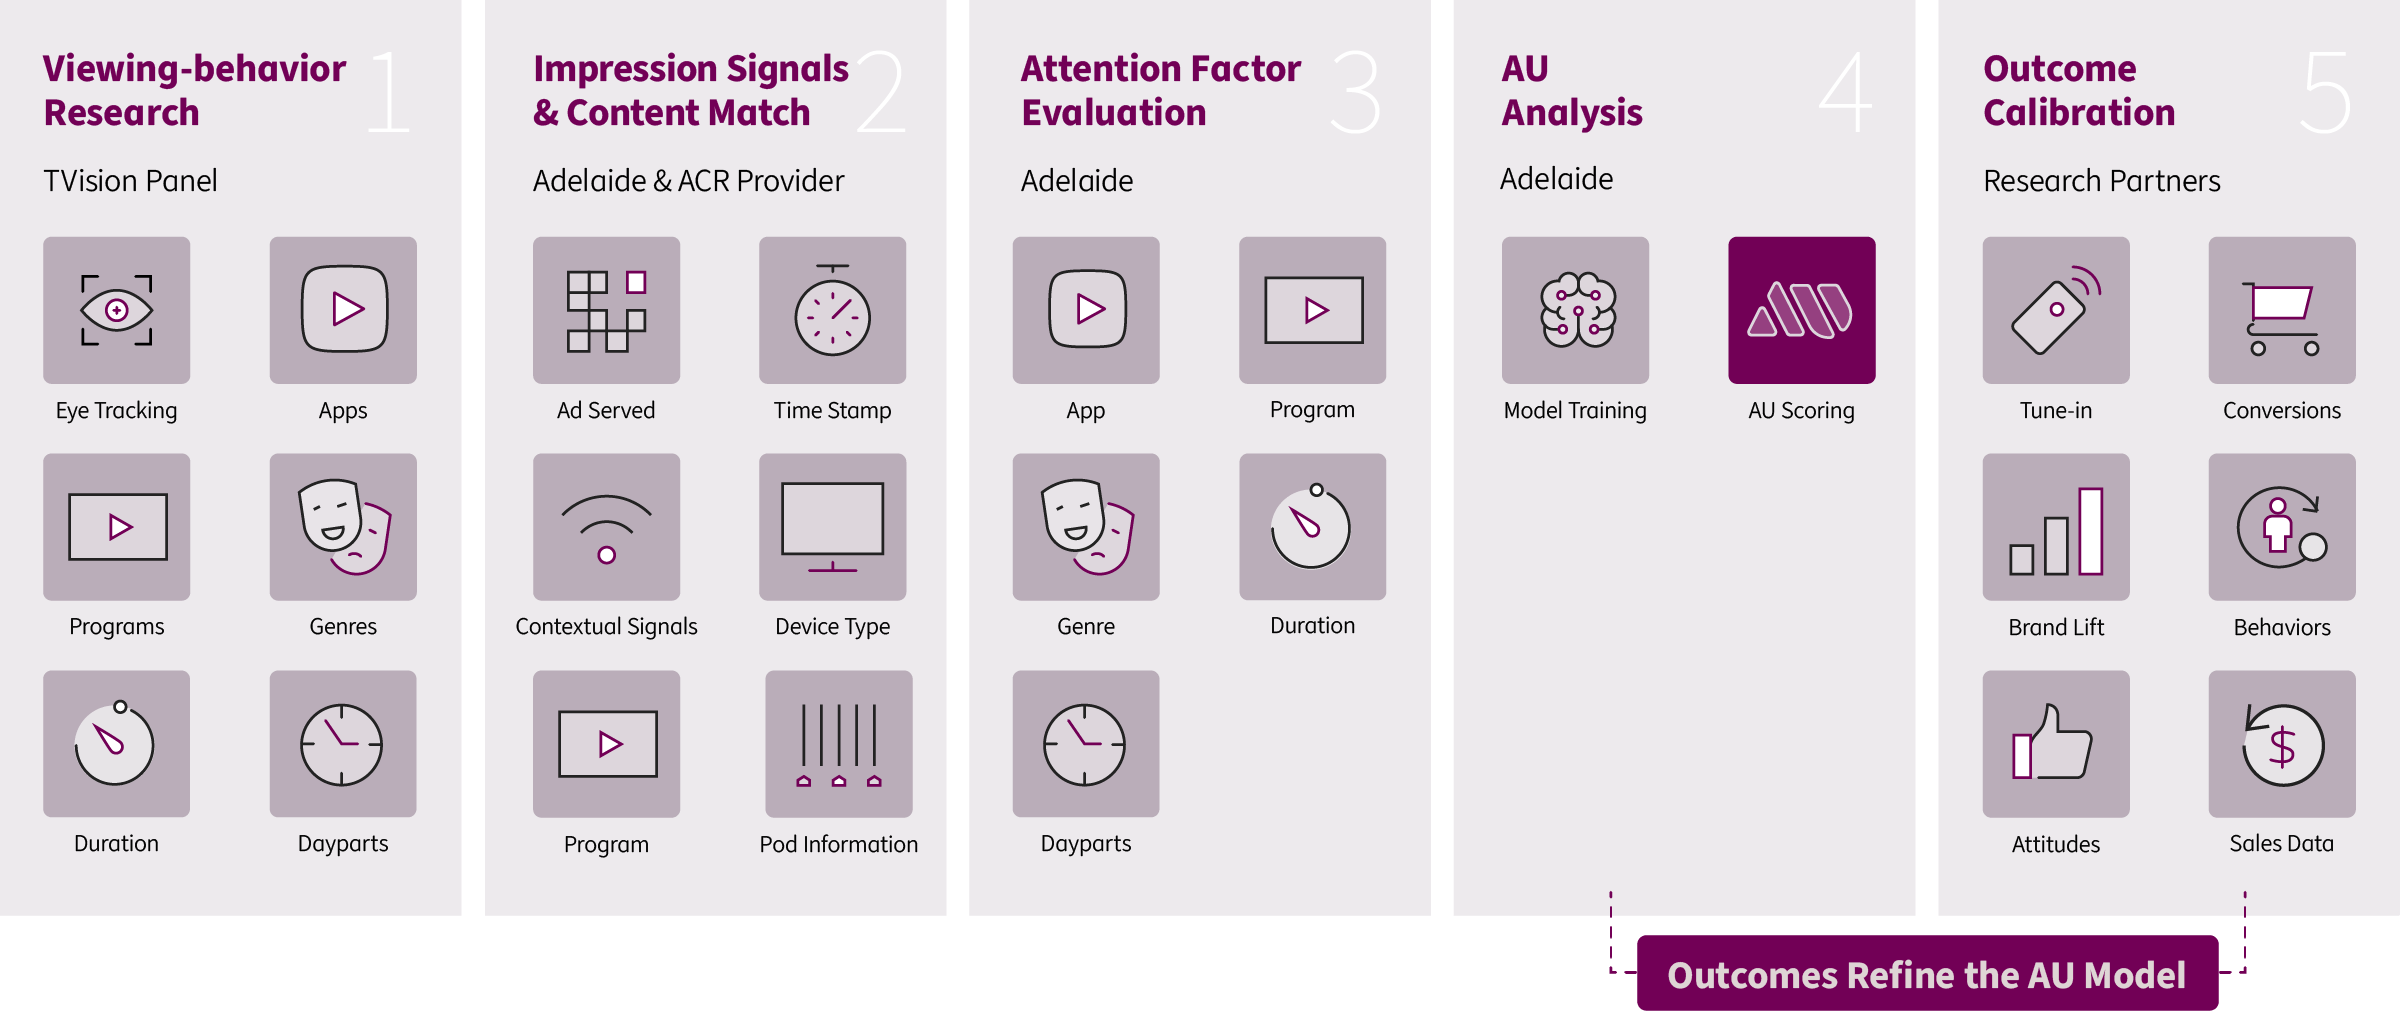
Adelaide incorporates TVision data, a panel-based source that tracks CTV viewing behavior across apps, genres, and dayparts. This research helps establish which placement characteristics most influence attention in a CTV environment. It tells the AU model which variables to weight before a single impression is served.
At the impression level, Adelaide fires an image pixel the moment an ad is served, capturing device type, timestamp, and contextual signals to identify the streaming environment. That data is matched to program and pod information via an Automatic Content Recognition (ACR) provider, linking ad exposure to the content airing at that moment.
The AU model is trained and calibrated against real full-funnel outcomes, including brand lift data from partners like Kantar, Lucid, and Dynata; tune-in attribution from providers like Samba and VideoAmp; and sales and conversion data from advertiser measurement. That training is what makes AU predictive. Scores reflect the likelihood of attention and impact, not just the mechanics of delivery.
The result is a placement-level media quality score built on proven viewing behavior and outcome data. Across CTV, placements average 67 AU, approximately 23% higher than Adelaide’s linear TV benchmark.
What Drives CTV AU
The signals that shape AU for CTV reflect how streaming TV is consumed. Unlike display, CTV does not rely on page-level characteristics like placement position or clutter. Instead, Adelaide evaluates media quality signals such as app and publisher, app type (e.g., BVOD, SVOD, FAST), program genre, time of day, and pod position.
Some inputs matter across multiple channels. Pod position, for example, can influence media quality in CTV, streaming audio, and linear TV. AU accounts for both shared and channel-specific inputs, allowing each environment to be measured according to the factors that shape attention and performance within that channel.
Adelaide only considers impressions that ran on an actual television device to be CTV. Streaming video and full-episode player impressions served on desktop, laptop, mobile, or tablet devices are classified under Adelaide’s OLV model. That distinction matters because an ad viewed on a TV screen creates a different attention environment than the same ad viewed on another device.
How Adelaide Measures Media Quality in Linear TV
Adelaide measures the quality of linear TV media through post-log reporting. Advertisers share logs or post-campaign reports, which are processed through the linear TV AU model and matched with TVision panel data at the highest available level of granularity.

Depending on the reporting provided, the model scores linear TV spots using signals such as program, network, genre, pod position, hour of day, and ad duration. Like all AU models, linear TV AU is trained to proxy full-funnel outcomes, helping advertisers evaluate quality based on its expected contribution to impact.
Advertisers can use AU insights for campaign analysis, planning, and optimization. They can compare media quality across networks, programs, genres, and dayparts to understand which parts of the plan created stronger opportunities for attention, then carry those learnings into future TV buys. This helps teams move beyond reach and frequency alone to identify the media investments most likely to deliver value.
Why Media Quality Matters for Modern TV Advertising
The value of TV media quality shows up in outcomes.
Across Adelaide's research, higher-AU linear TV and CTV media have been linked to stronger results across brand and performance KPIs, including sales, tune-in, and awareness:
- A food and beverage brand found that CTV placements above its AU quality floor delivered 94% more sales conversions than media below it.
- A retailer saw double-digit conversion lifts across affinity, retargeting, and conquesting audiences by prioritizing high-AU CTV inventory.
- A social media platform found that high-AU linear TV spots drove a 50% lift in unaided awareness and a 44% lift in favorability versus low-attention spots.
- For the NBA, viewers exposed to the highest-AU CTV media were 38% more likely to tune in than those exposed to the lowest-AU media. View the case study.
These results reinforce why marketers are using attention metrics to bring greater accountability to TV investment, a topic Adelaide's VP of Research, Claire Browne, explored in MediaVillage.
GRPs, reach, impressions, and completion rates each have a role in TV measurement. They help advertisers understand delivery and scale. But they do not show whether a TV ad had a meaningful opportunity to capture attention or influence the results brands ultimately care about.
AU adds a media quality layer to TV measurement, helping advertisers evaluate the quality of their CTV and linear TV investments with greater precision and understand how TV media quality compares with the rest of the plan.
More results across channels and industries are available in the 2026 Adelaide Outcomes Guide. Download our CTV Measurement Overview and Linear TV Measurement Overview to learn more about how AU works in each channel.