The Year in Attention 2021: Correlations Preview
We'll be documenting some of the best in an upcoming free guide early next year. In the meantime, here's a quick preview of results from four diverse industries.
1 | Uncle Sam Needs Attention, Too
Adelaide partnered with a governmental advertising and research agency to analyze the impact of attention on upper- and mid-funnel outcomes. We tracked over 150 million impressions across Display, online video (OLV), YouTube, and Facebook, correlating AU scores with both direct-response and brand survey results.
Adelaide proved that AU had a significant impact on the effectiveness of key metrics including site visitation, cost efficiency, and brand support.
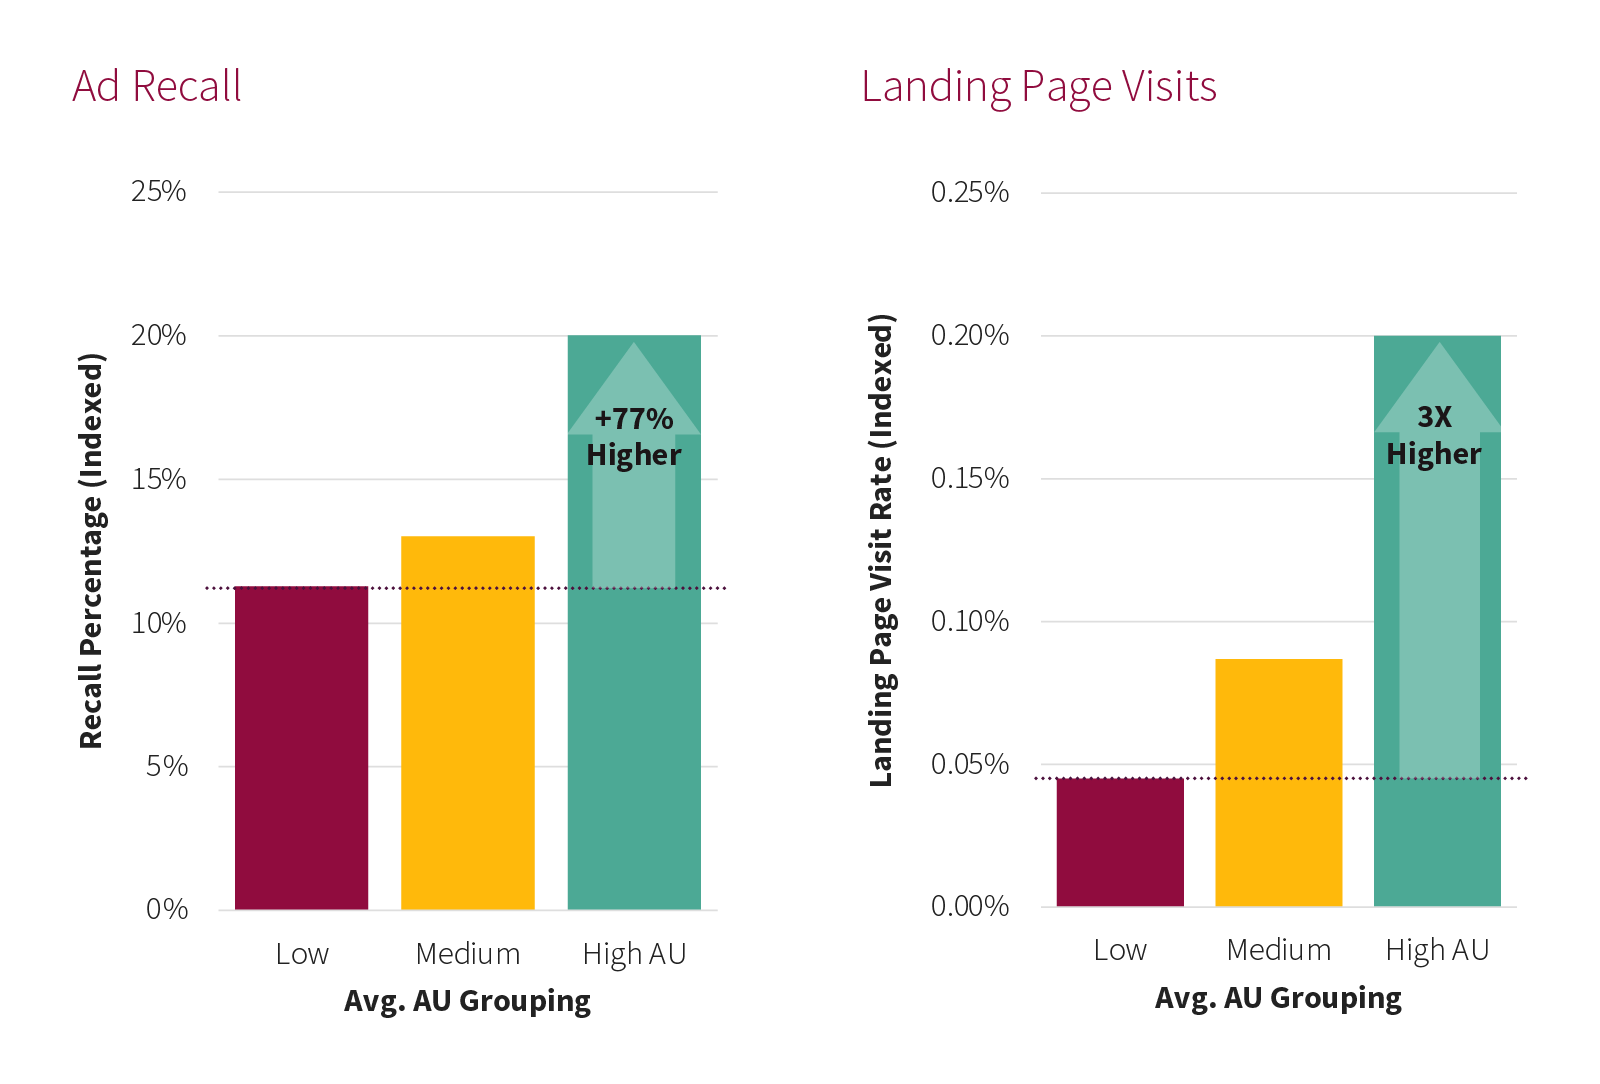
Respondents exposed to high-AU media were 77% more likely to recall an ad and 3x more likely to visit the landing page than those exposed to lower-AU placements. Our analysis also revealed several channel-specific insights. For example, YouTube delivered the highest average AU and the lowest cost per AU or any channel or partner measured. These findings indicate that optimizing towards AU could drive significant gain. For Display in particular, shifting ad spend from low-AU placements to those with higher AU scores could result in ~17% more site visits.
2 | Credit Where It’s Due
Working with a leading consumer credit card company, we A/B tested AU-optimized placements versus “Business as Usual” (BAU) optimizations to determine whether attention metrics could be used to drive lifts in mid-funnel metrics.
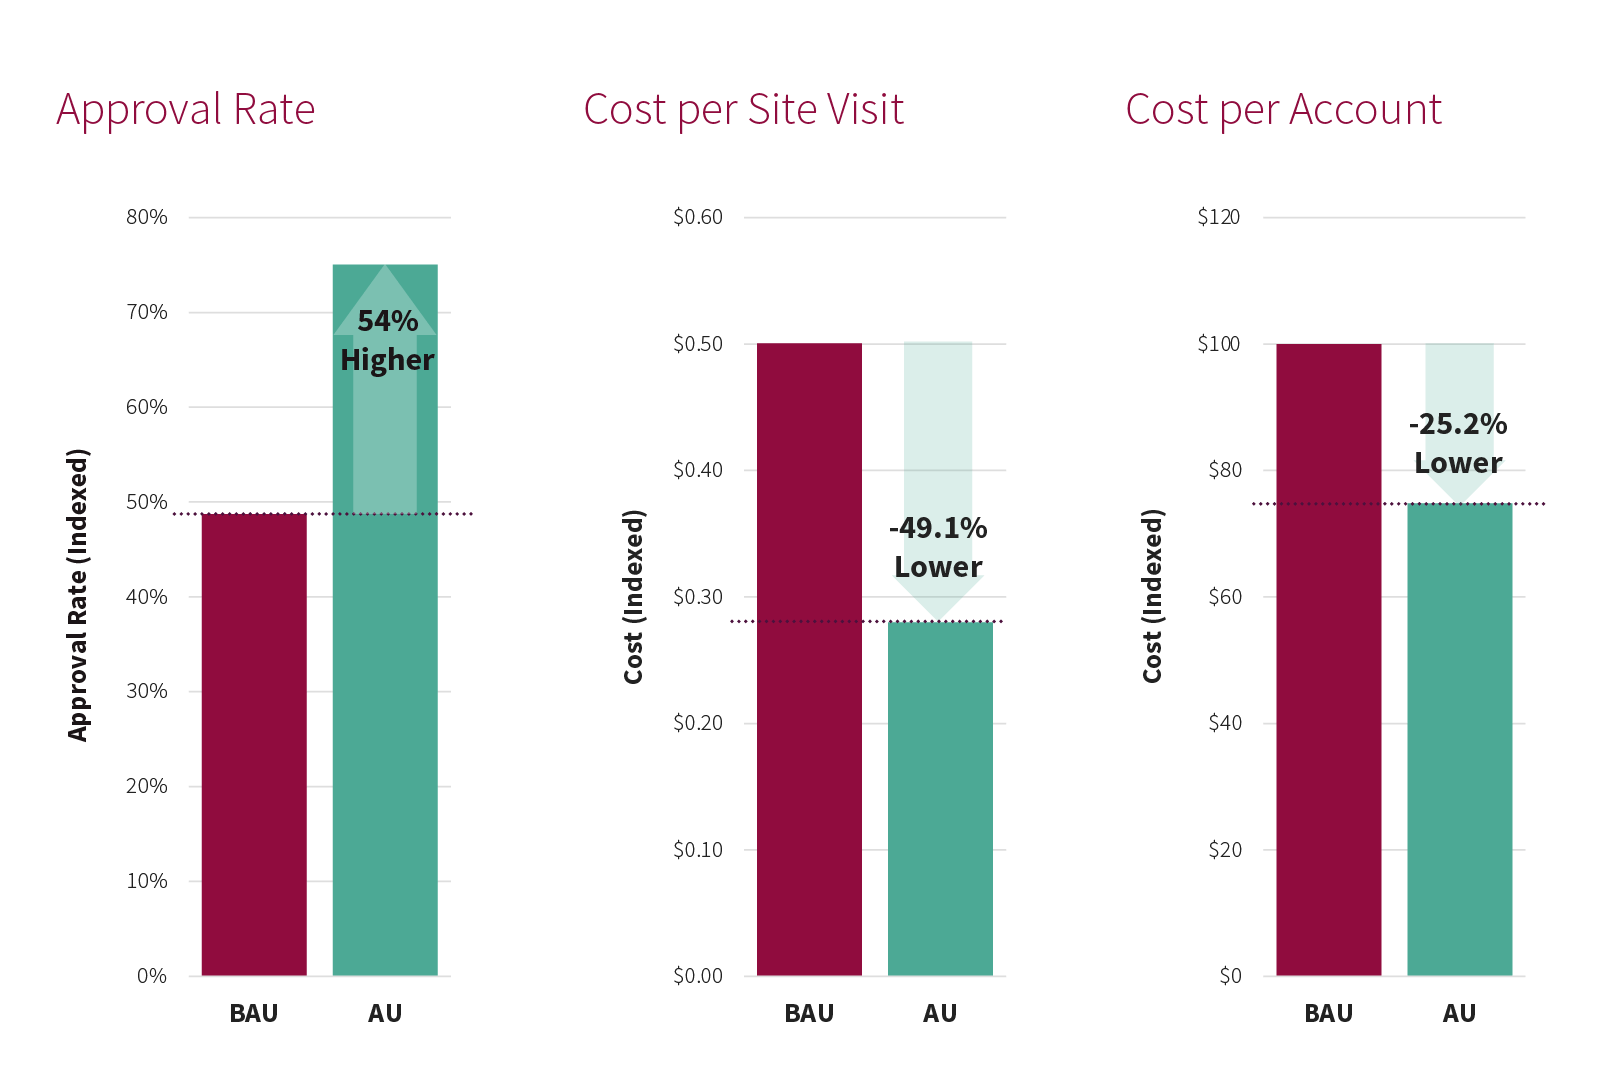
Adelaide delivered greater efficiency for Cost per Site Visit, Cost per Account, and an overall higher Approval Rate compared to BAU. While application costs were slightly higher, the end result was a 25% lower cost per account. We also found that AU optimizations delivered 23% lower application drop-off among exposed individuals and 74% more site visits.
3 | Swish
This past fall, we announced the expansion of AU measurement into CTV, sharing the results of our first-ever CTV pilot with the NBA and Mediahub.
Adelaide measured AU across CTV, Display, OLV, and a later, Walled Gardens, to determine whether higher-AU media drives subsequent increased Tune-in.
By focusing its media budget on high-AU placements, the NBA achieved 36% higher Tune-in for live games. High-AU OLV placements also drove over 3X the Tune-in of low-AU placements.

The NBA now uses AU as its main optimization metric as it provides clear and tactical guidance for real-time optimizations, helping them achieve better results.
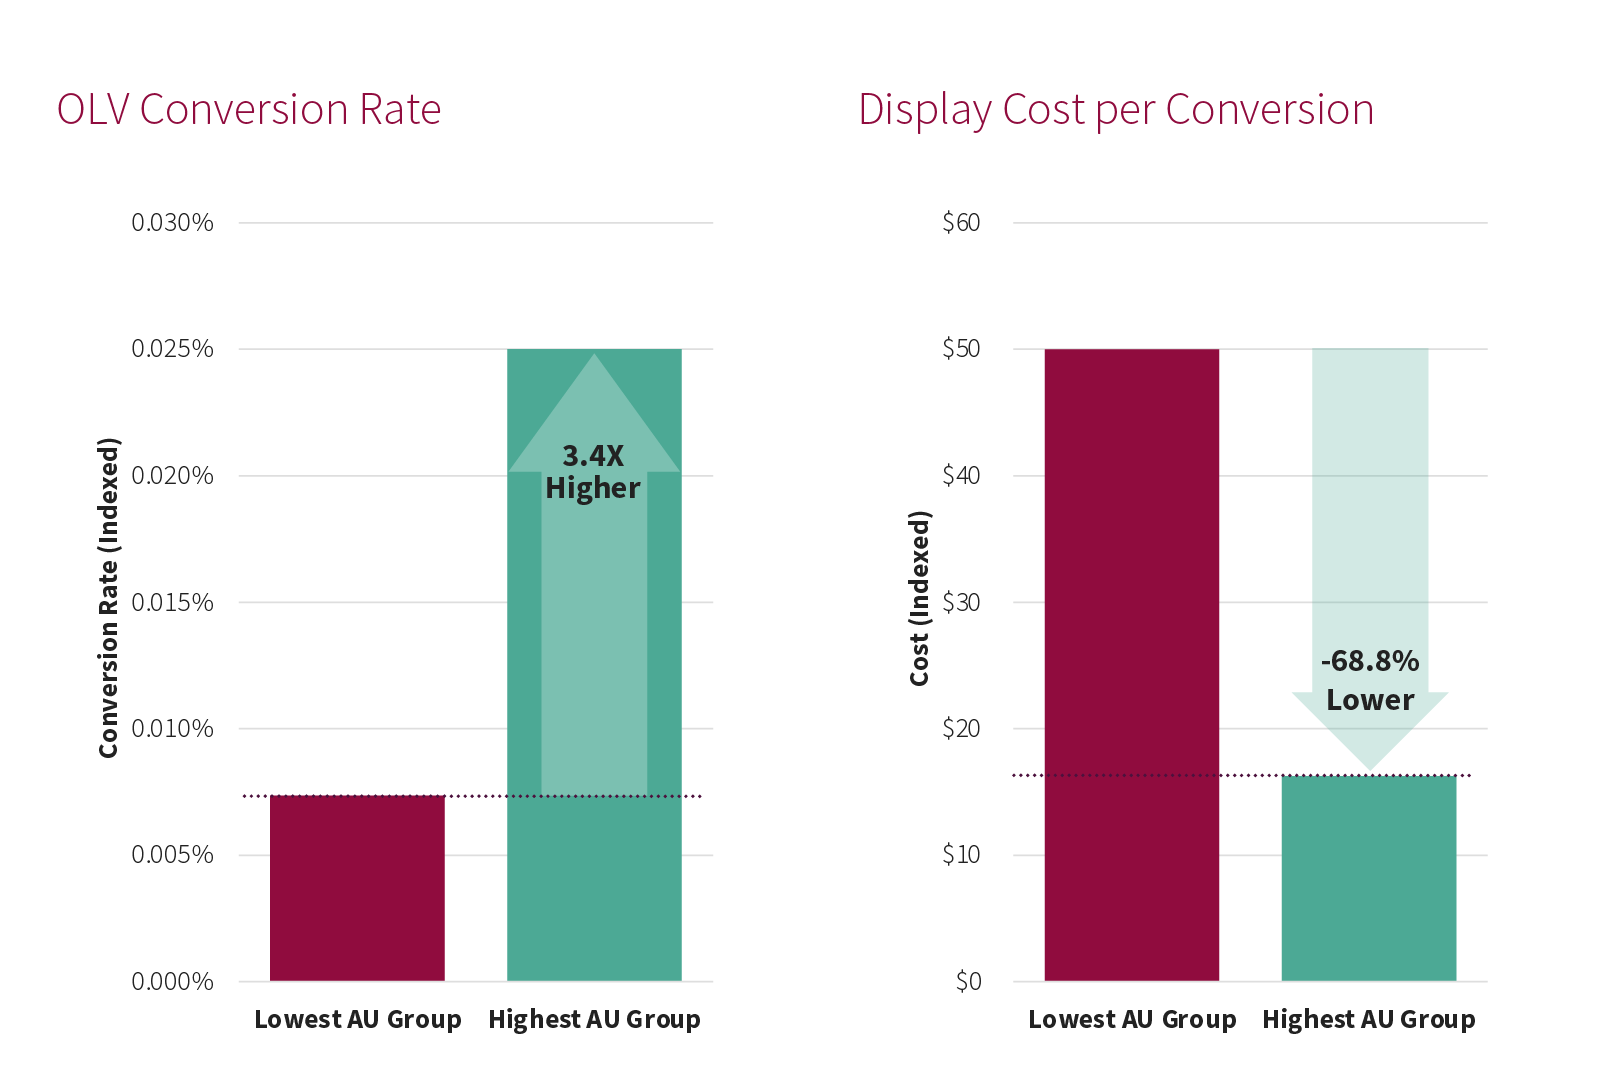
4 | Delivering the Goods
Working with a major CPG brand and in-store sales measurement provider, IRI, Adelaide found that high-AU media leads to increased sales with a lower cost per conversion. We measured AU across Display and OLV media and found that high-AU OLV placements drive 3.4X higher sales impact than low-AU placements. High-AU Display media also showed a 69% decrease in the Cost per Conversion compared to low-AU media.