Financial Services
+97%
Lift in unaided awareness
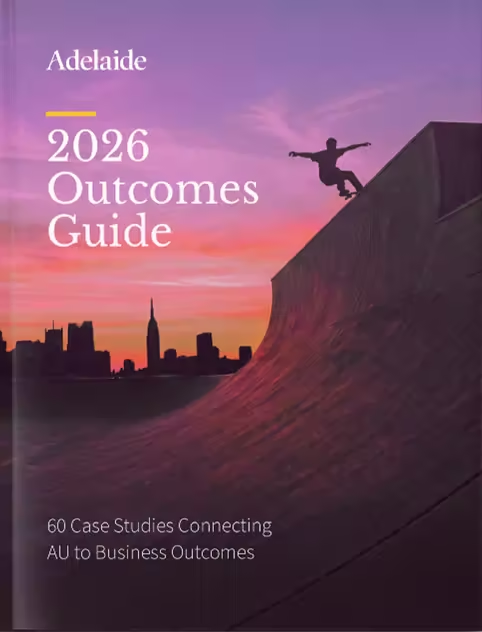
The 2026 Outcomes Guide
So the question is simple: does attention actually move the needle?
At Adelaide, we don’t speculate. We measure.
The 2026 Outcomes Guide shows what happens when advertisers get attention right—and how to put attention metrics to work in your own campaigns.


The top 10 ways advertisers use attention metrics today, from planning through activation
15 key shifts shaping attention in 2026, including what’s changed since last year
Dozens of practical strategies and takeaways you can use across channels and KPIs
Advertisers trust Adelaide’s omnichannel media quality metric, AU, because it’s proven to predict full-funnel outcomes.
The Outcomes Guide brings that connection to life, showing how attention metrics drive superior results across brands, industries, and objectives.