CTV & Attention Metrics: The Essential FAQ Guide for Advertisers
Connected TV (CTV) has reshaped how advertisers think about media quality. Streaming now accounts for 46% of TV viewing time, yet marketers still lack precise metrics to evaluate the quality of CTV environments.
Adelaide’s attention measurement fills that gap by predicting any placement’s likelihood of driving attention and outcomes, giving advertisers a clearer view of CTV performance and exposing meaningful quality differences in a channel that can otherwise appear uniform with today’s metrics.
Total TV & Streaming Snapshot
- 6.7%Other Streaming
- 12.8%

- 8.3%

- 4.8%

- 3.6%

- 2.5%

- 2.2%

- 2.0%

- 1.5%

- 1.4%

What Are Attention Metrics?
Quick Answer: The IAB defines Attention Metrics as measures or predictions of a person’s focus on an ad, derived from visual and/or audio tracking, physiological and/or neurological observations, data signals, and survey-based methods. Because attention is complex and influenced by many factors, metrics that combine several inputs offer far stronger predictive power than any single signal.
Adelaide’s omnichannel attention metric, AU, is a 0–100 media quality rating that predicts how likely an ad placement is to capture attention and drive outcomes. AU incorporates all four IAB-defined attention measurement approaches by combining:
AU provides a consistent way to measure and compare media quality across channels, helping advertisers make smarter investment decisions and improve campaign outcomes.
How Does Adelaide Measure Attention In CTV Environments?
Each channel’s AU model is trained on the media quality signals that shape attention in that specific environment.
Step 1: Identify the Signals That Influence Attention in CTV
We use opt-in eye-tracking data from partners like TVision and other attention research to understand which characteristics of CTV placements matter most. By analyzing how real viewers consume ads, we identify which media quality signals reliably impact attention, including:
- Streaming app and publisher
- Show and genre
- Daypart and day of week
- Pod position
- Duration
- Device type
This phase reveals the traits that make CTV placements more or less likely to capture real human attention.
Step 2: Collect Data Across Every CTV Placement
We capture these placement-level characteristics using 1x1 pixels, licensed datasets, DSP logs, content metadata from partners like IRIS.TV, and programming data from streaming platforms.
Step 3: Build the Model and Train to Outcomes
Our machine learning models are trained using real outcomes from advertising campaigns. Outcome data—sourced from survey partners, attribution providers, and measurement conducted with advertisers—spans everything from brand awareness to sales. These inputs ensure AU scores accurately predict real-world advertising impact.
Step 4: Assign an AU Score to Each Placement
The AU model synthesizes all inputs to generate a single, normalized score for each placement, enabling consistent media quality comparisons across channels.
Why Do Attention Metrics Matter in Streaming?
AU exposes this variation clearly. The graph below shows a bimodal distribution in AU scores across CTV inventory, revealing quality metrics that traditional metrics ported from other digital formats fail to capture.
Adelaide’s meta-analysis of YouTube’s premium ad solutions underscores the point. Compared to nine of the largest streaming platforms, YouTube Select placements on TV screens delivered a 19% higher likelihood of attention and impact.
If CTV Has 95% Completion Rates, Why Measure Attention?
High completion rates reinforce the illusion that all “premium” CTV impressions are equally valuable. But non-skippable doesn’t mean non-ignorable, and completion alone can’t reveal whether an ad was truly high quality or likely to drive business outcomes.
Research across the industry shows:
- 95% of CTV viewers multitask while watching TV (LG Ad Solutions, 2025)
- Distractions reduce attention—for example, when kids are present, adult attention declines (TVision, 2025)
- 38% of viewers watch TV with sound off, earbuds in, or closed captioning (TVB, 2025)
- 4% of CTV viewers tune out each minute during ad breaks, meaning for a 3-minute commercial, a channel loses 12% of its audience (Wurl, 2024)
This gap between delivery and engagement helps explain why higher-AU CTV placements consistently outperform lower-AU ones—even when their completion rates are identical.
Viewability vs. Attention: What’s the Difference?
Viewability = technical delivery.
CTV standards require 50% of ad pixels to be in view for 2+ seconds. Because most CTV ads render full-screen, they’re typically considered 100% viewable.
Attention Metrics = human engagement and impact.
Adelaide’s AU metric measures the likelihood a media placement will actually capture attention and deliver brand or business results.
Two CTV placements can both be 100% viewable yet perform very differently:
- Low-impact: FAST app, late-night slot, middle pod position, low AU
- High-impact: SVOD app, primetime slot, pod position A, high AU
In an environment where practically everything is viewable, attention becomes the true differentiator of performance.
How Do Attention Metrics Improve CTV Advertising Impact?
Attention metrics connect CTV media quality directly to outcomes, making it easy to see which placements drive real impact and which quietly waste budget.
With AU, advertisers can:
- Understand Media Quality: Assess media quality across CTV inventory to uncover performance drivers that traditional metrics miss.
- Improve Media Planning: Identify top-performing placements, platforms, and publishers, and set the right AU thresholds to prioritize high-impact media from the start. By holding media quality constant, advertisers can also run clean A/B tests comparing creative or messaging without media bias once campaigns are live.
- Optimize Media Spend: Shift investment toward efficient sources of high-attention CTV impressions to improve campaign results.
To make attention activation simple, Adelaide is integrated with 125+ DSPs, SSPs, and sell-side partners:
- High-AU PMPs curated by SSPs like PubMatic and TripleLift surface high-attention inventory for targeting in any DSP.
- AU Pre-Bid Segments act as media quality filters, allowing bids only on CTV inventory that meets defined quality thresholds—available in The Trade Desk.
- AU-Powered Custom Bidding Scripts in Google DV360 dynamically bid up high-value CTV impressions and reduce spend on lower-quality inventory.
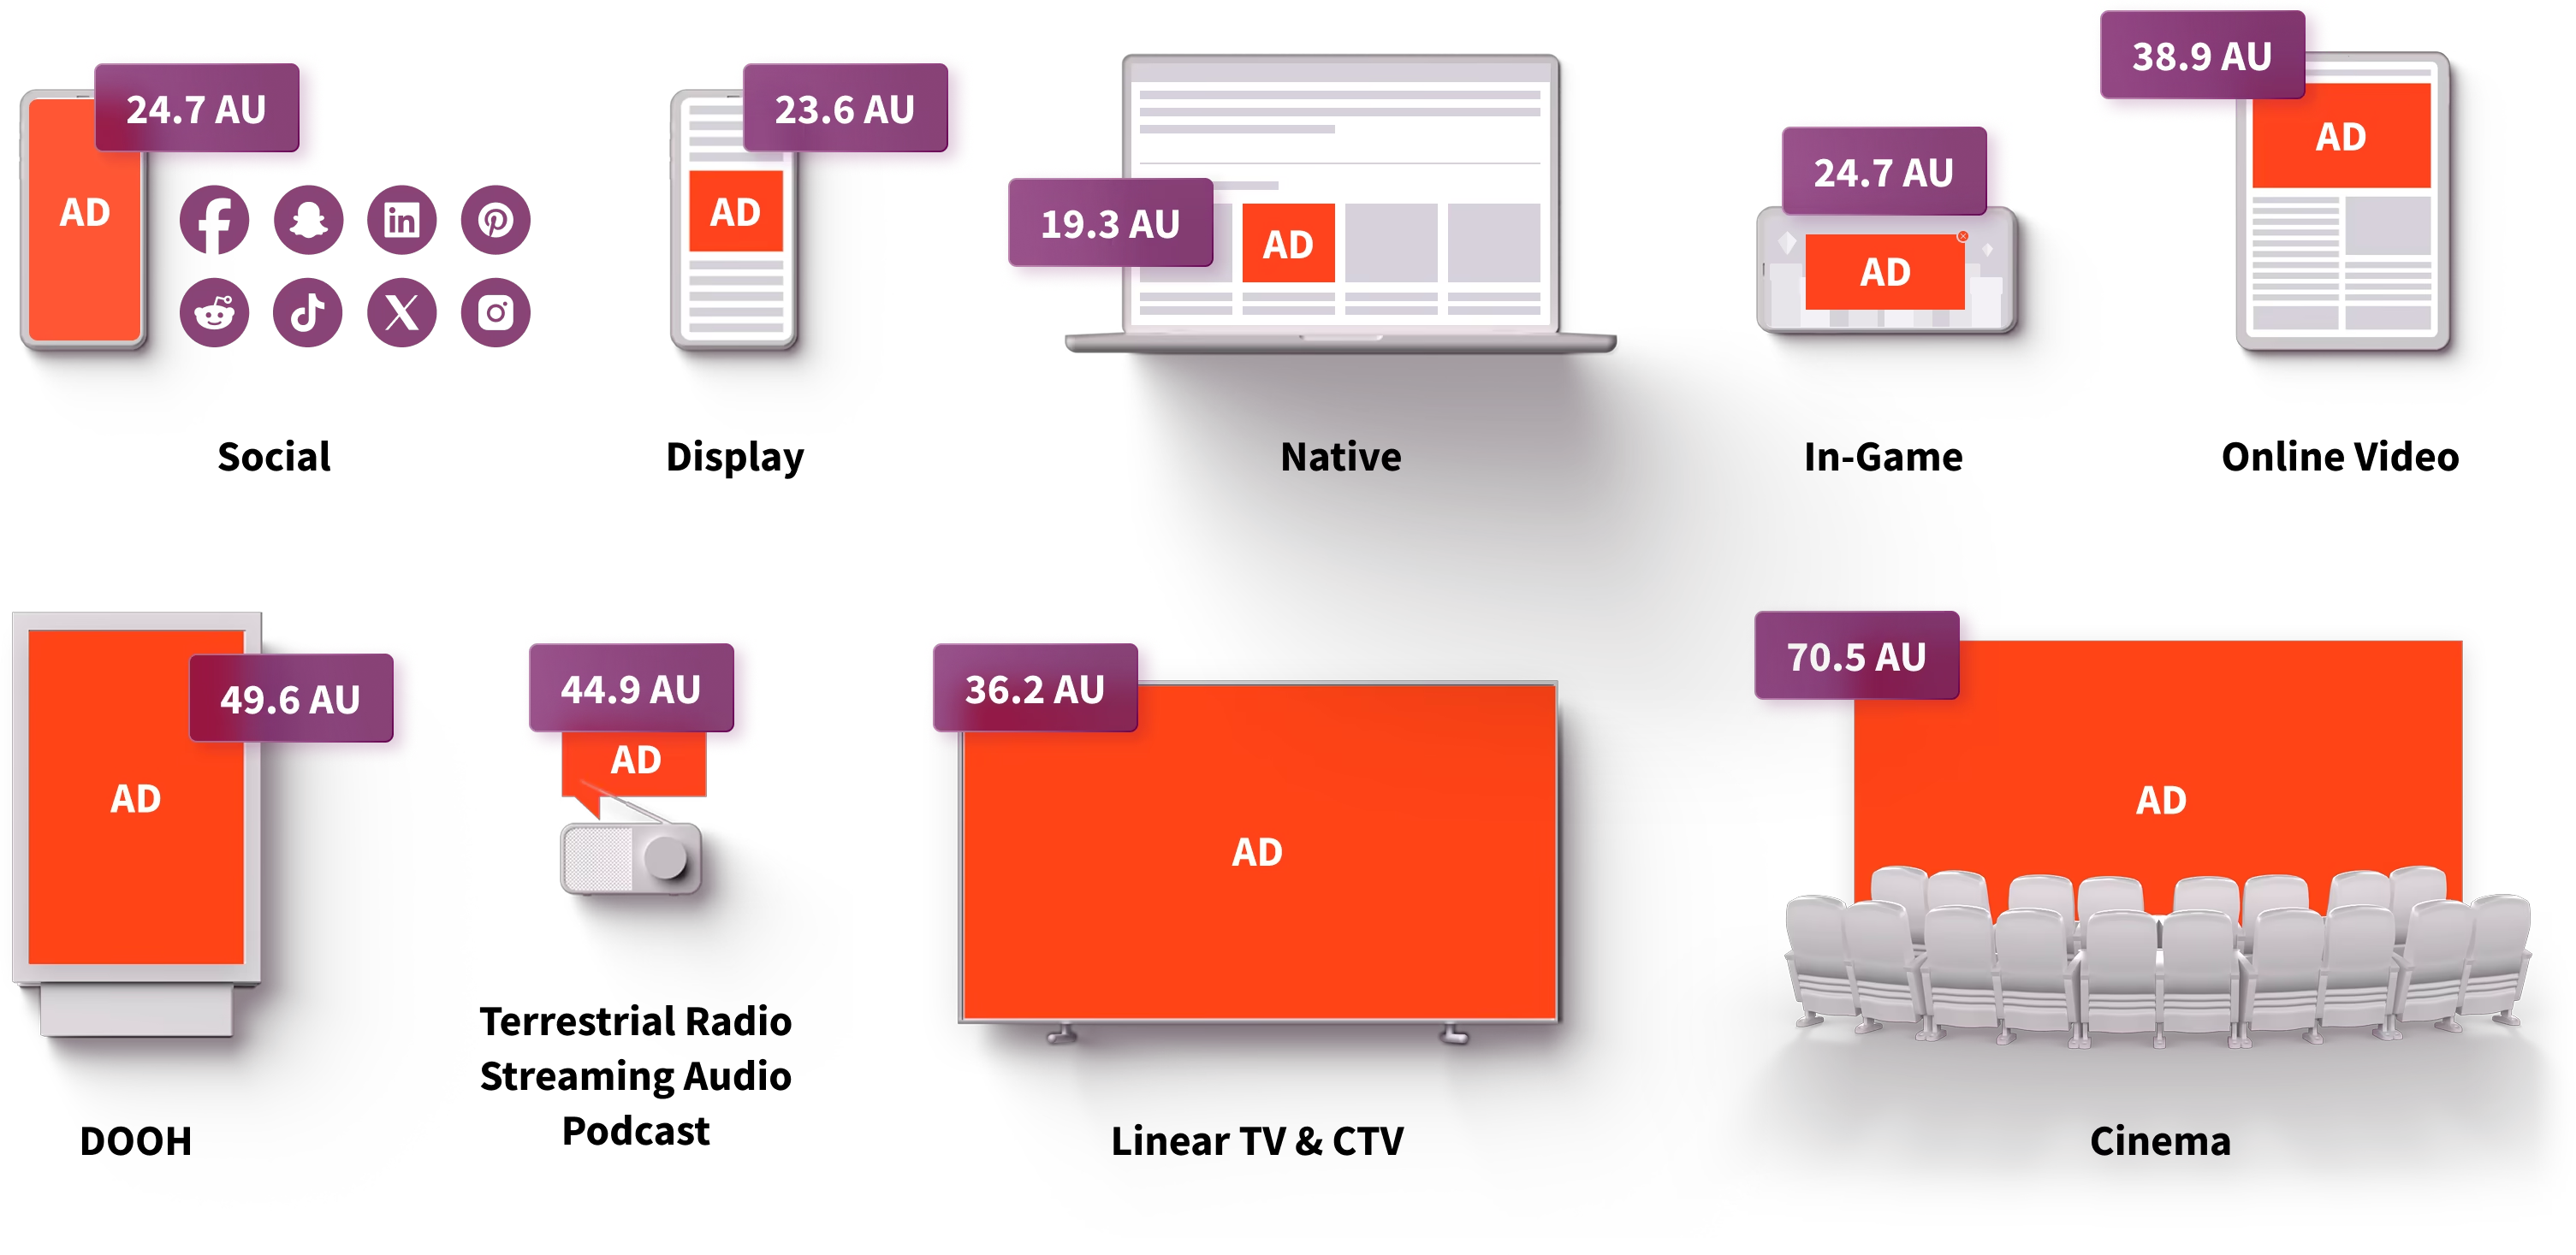
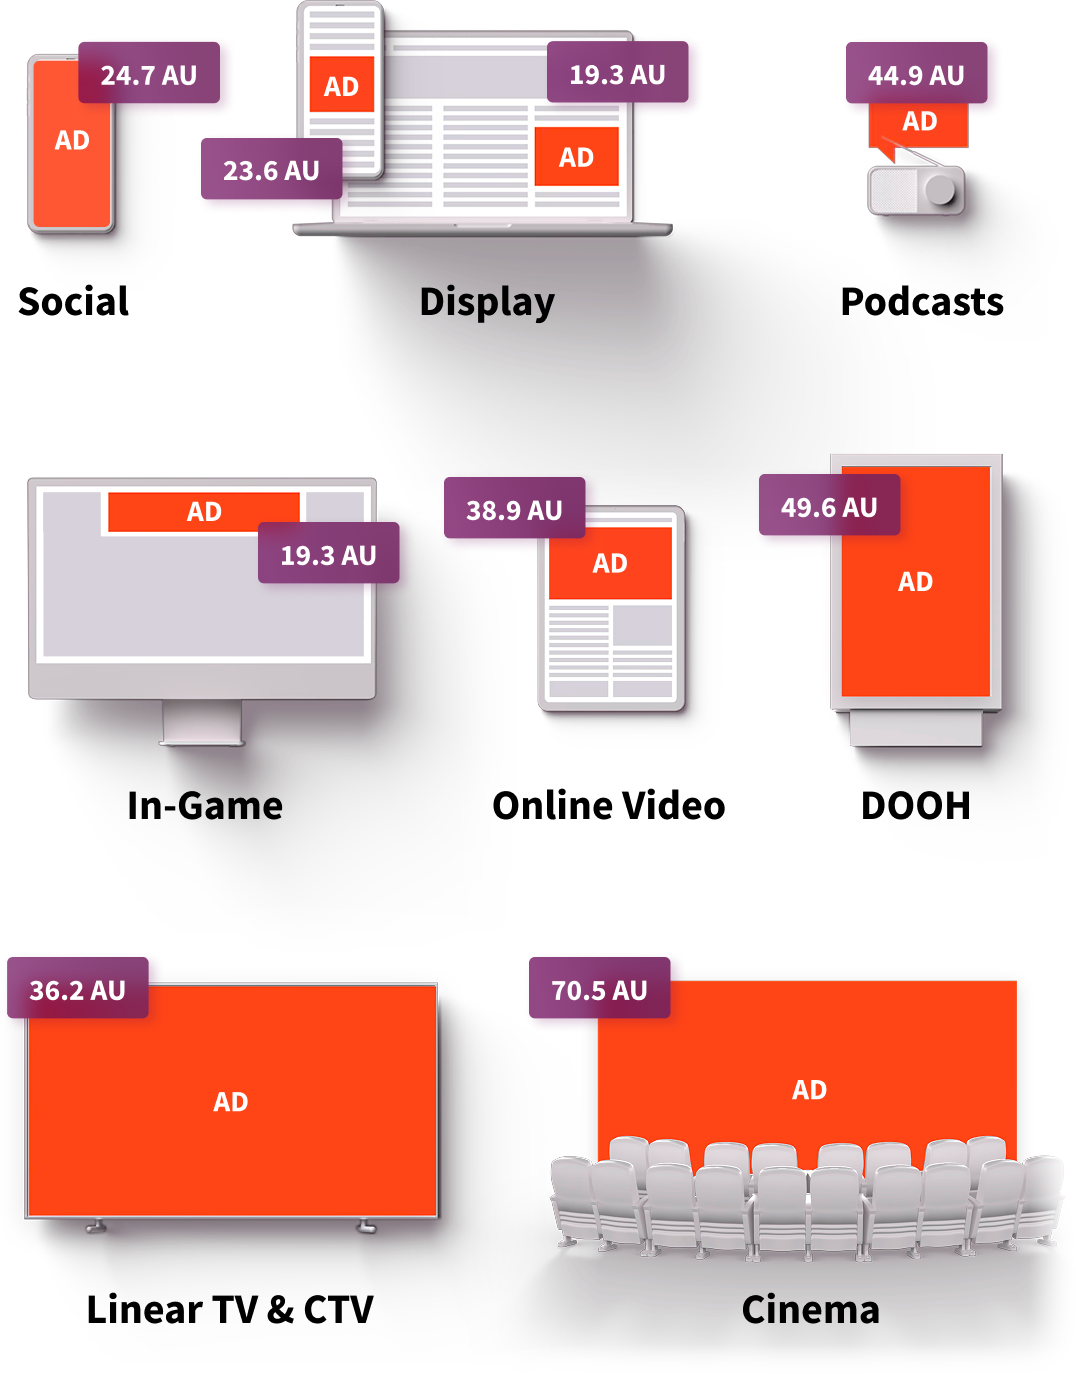
How Does CTV Attention Compare to Other Channels?
CTV consistently commands the highest attention across digital channels. According to Adelaide’s global benchmarks published in eMarketer, CTV outperforms:
- Display by 180%
- Online Video (OLV) by 66%
- Streaming Audio by 54%
AU data also shows that CTV placements deliver a 25% higher probability of attention and impact than linear TV.
What Attention Benchmarks Should Advertisers Target?
While Adelaide’s CTV benchmarks offer general guidance, a brand’s optimal AU target depends on industry, campaign goals, and KPIs. Adelaide helps advertisers identify where raising the AU floor delivers the strongest lift while maintaining scale. Visualizing performance curves makes it easy to see where improvements in CTV media quality generate the greatest returns.
The Bottom Line
Attention Metrics aren’t “nice-to-have”—they’re essential for understanding what actually drives advertising performance in streaming. CTV may command high attention compared to other channels, but that attention isn’t distributed evenly. AU pinpoints where quality truly exists so advertisers can capitalize on CTV’s full potential.
As streaming evolves into a more performance-driven channel—with platforms introducing interactive ad formats and direct response pathways—AU provides the outcome-validated foundation marketers need to invest confidently, optimize efficiency, and stay ahead in a fast-changing landscape.